Introduction Stock charting software is an essential tool for technical analysis, market research, and trade execution. With the rise of
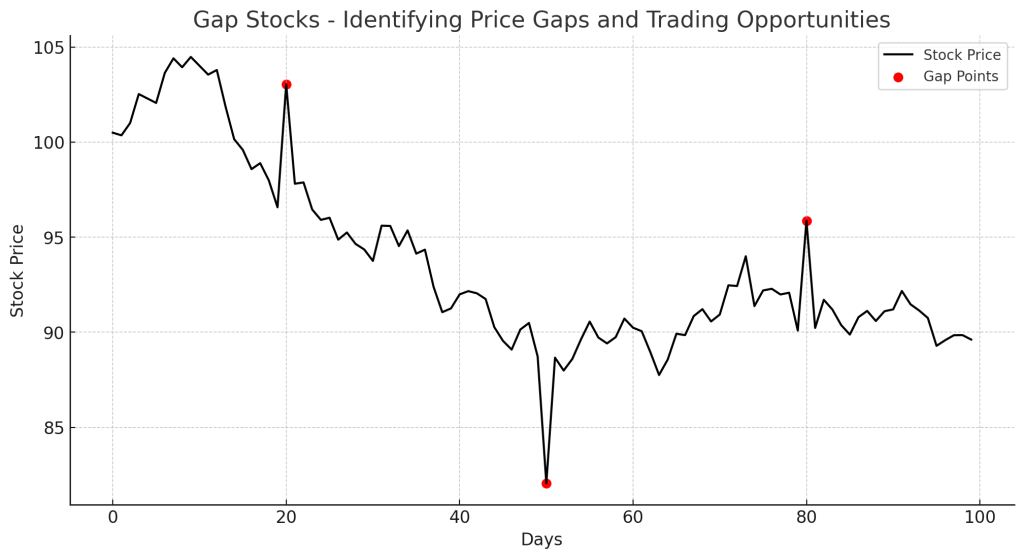
Introduction Gap stocks are stocks that experience a price gap between two trading sessions, where the stock opens significantly higher
Candlestick reversal patterns help traders identify potential trend reversals in the market. These patterns signal a shift in market sentiment,
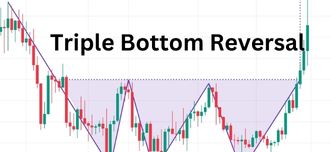
The Triple Bottom Reversal is a bullish reversal pattern that signals the end of a downtrend and the beginning of
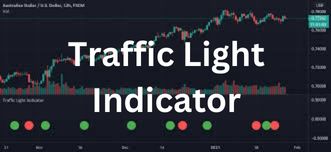
The Traffic Light Indicator is a visual trading tool that helps traders quickly assess market conditions using a color-coded system—just
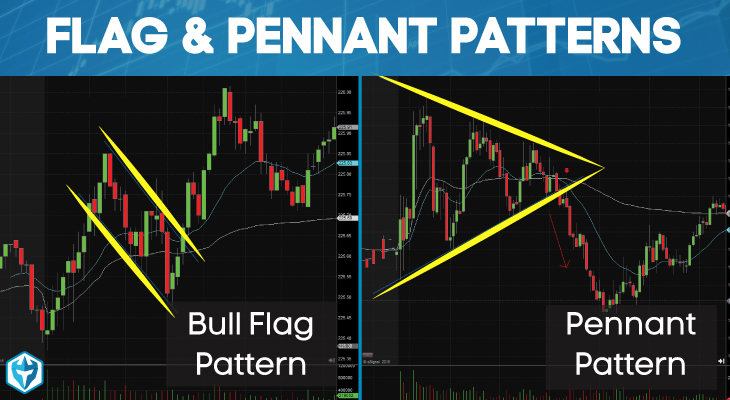
Trading Flags and Pennants: Powerful Continuation Patterns Flags and Pennants are two of the most reliable continuation patterns in technical
The Triple Exponential Moving Average (TEMA) is a trend-following indicator that smoothens price data while minimizing lag. Developed by Patrick
Bullish chart patterns help traders identify potential buying opportunities by signaling a trend reversal or continuation. These patterns appear in
Navigating stock markets for successful trading demands a keen understanding of trends, momentum, and prevailing market conditions. Technical indicators empower
The TTM Squeeze Indicator is a momentum and volatility-based trading tool that helps traders identify potential breakout opportunities. Developed by
The True Strength Index (TSI) is a momentum-based indicator that helps traders identify trend direction and potential reversals. Developed by
Technical indicators are mathematical calculations. They use a security’s price, volume, or open interest. Ultimately, these indicators help traders identify

