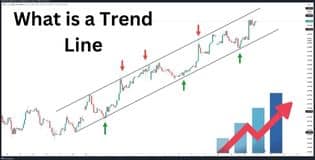
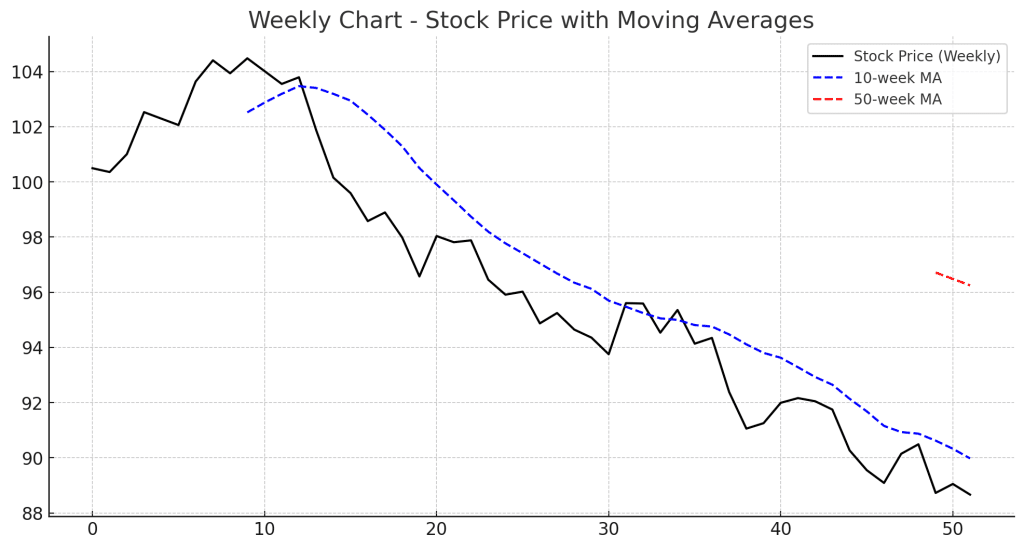
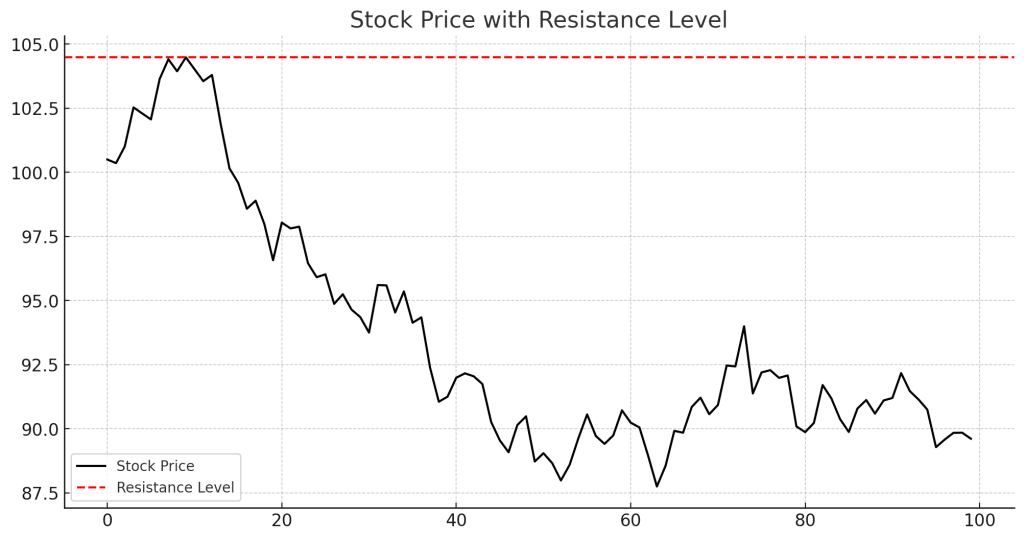
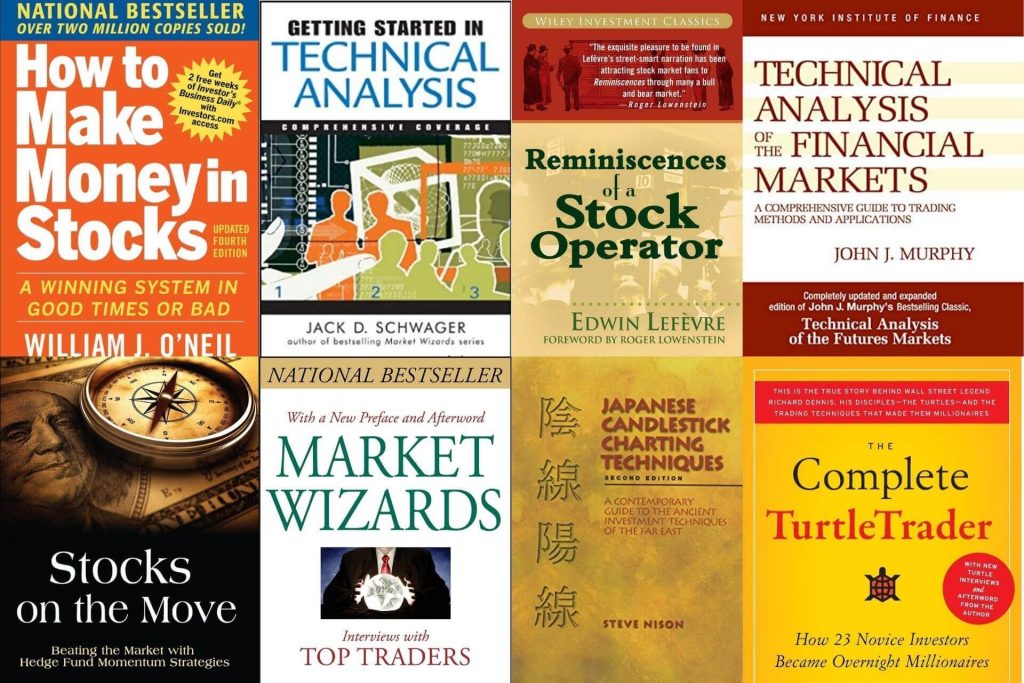
vijay kumar August 28, 2025 How to Pick Stocks for Swing Trading: 7 Key Criteria for Consistent Gains Swing trading is all about capitalizing on short- to medium-term price moves. But your success heavily depends on which stocks Read More vijay kumar August 27, 2025 How to Trade Options: A Beginner’s Guide (2025) Options trading offers flexibility, leverage, and unique strategies that can suit any market condition. Whether you want to hedge your Read More vijay kumar August 26, 2025 Stochastic RSI (StochRSI): A Powerful Momentum Indicator Introduction The Stochastic RSI (StochRSI) is a technical momentum indicator that combines the Relative Strength Index (RSI) with the Stochastic Read More vijay kumar August 25, 2025 Stochastic Oscillator: A Key Momentum Indicator in Trading Introduction The Stochastic Oscillator is a popular momentum indicator used in technical analysis to determine the strength and direction of Read More vijay kumar August 24, 2025 Relative Strength Indicator (RSI): A Vital Tool for Momentum Trading Introduction The Relative Strength Indicator (RSI) is a momentum oscillator that measures the speed and change of price movements. RSI Read More vijay kumar August 23, 2025 Relative Strength Index (RSI): A Key Momentum Indicator Introduction The Relative Strength Index (RSI) is a widely used momentum indicator in technical analysis that measures the speed and Read More vijay kumar August 22, 2025 What is a Trend Line? Introduction A Trend Line is a fundamental tool in technical analysis that helps traders identify the direction of price movements. Read More vijay kumar August 21, 2025 Weekly Stock Charts Introduction A Weekly Chart is a type of stock chart that represents price movements over a weekly timeframe. Each candlestick Read More vijay kumar August 20, 2025 Resistance Level: A Key Concept in Technical Analysis Introduction A Resistance Level is a price point where a stock or asset struggles to move above. It is formed Read More vijay kumar August 19, 2025 Best Stock Trading Books for 2025 Finding the best stock trading books can be overwhelming, especially with so many options claiming to unlock market success. While Read More vijay kumar August 18, 2025 Understanding the Falling Wedge Pattern: A Bullish Reversal Indicator The Falling Wedge Pattern is a technical analysis chart pattern that signals a potential bullish reversal during a downtrend or Read More vijay kumar August 17, 2025 Understanding the Envelope Indicator: A Tool for Identifying Market Extremes The Envelope Indicator is a technical analysis tool used by traders to identify overbought and oversold conditions, as well as Read More Previous Page1 Page2 Page3 Page4 Page5 Page6 Page7 Page8 Page9 Page10 Page11 Page12 Page13 Page14 Page15 Page16 Page17 Page18 Page19 Page20 Page21 Page22 Page23 Page24 Page25 Page26 Page27 Page28 Page29 Page30 Page31 Page32 Page33 Page34 Page35 Page36 Page37 Page38 Page39 Page40 Next