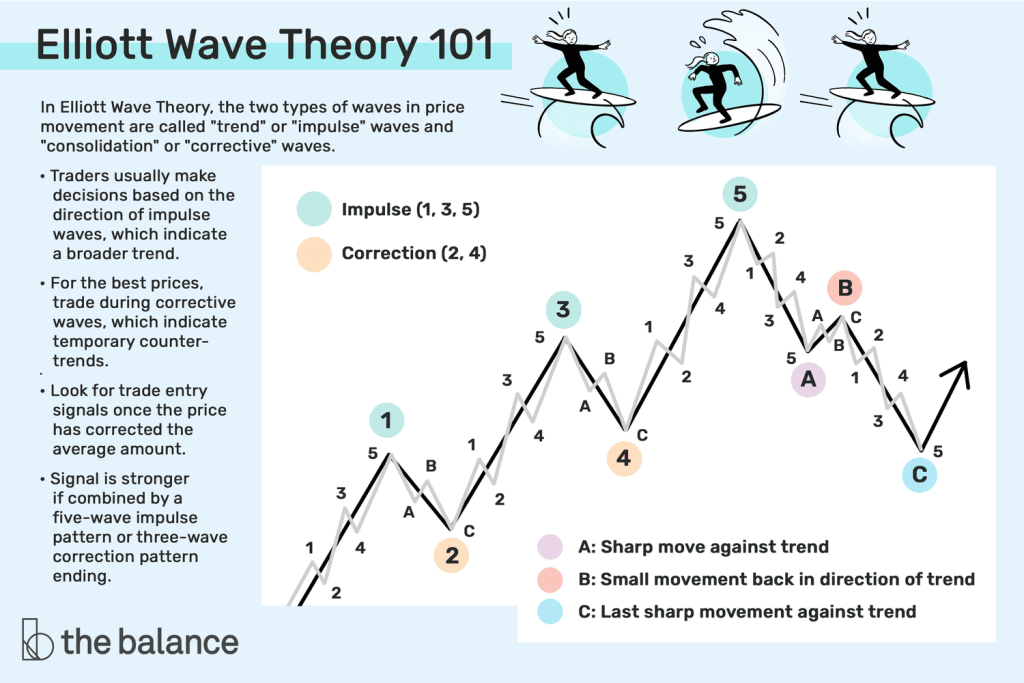
Elliott Wave Theory, developed by Ralph Nelson Elliott in the 1930s, is a technical analysis tool used to describe price […]
Elliott Wave Theory, developed by Ralph Nelson Elliott in the 1930s, is a technical analysis tool used to describe price […]
The Elder Force Index (EFI), developed by Dr. Alexander Elder, is a technical analysis indicator that combines price movement and […]

The Detrended Price Oscillator (DPO) is a technical analysis indicator designed to remove long-term trends from price data, allowing traders […]

Introduction In the realm of technical analysis, pivot points are essential tools that help traders identify potential support and resistance […]

The Alpha Rotation Trading System is a sophisticated investment strategy designed to adapt to changing market environments by rotating investments […]

Understanding the Average Directional Index (ADX) Indicator The Average Directional Index (ADX) is a technical analysis tool developed by J. […]
Pivot points are a popular technical analysis tool used by traders to identify potential support and resistance levels in the […]

Heikin Ashi is a unique candlestick charting technique that helps traders filter out market noise and identify trends more effectively. […]

Introduction The S&P 500 Chart provides traders and investors with insights into the performance of the S&P 500 Index, which […]

Introduction Reversal Candles are key candlestick patterns in technical analysis that signal a potential change in trend. Traders use them […]