Introduction A Trend Line is a fundamental tool in technical analysis that helps traders identify the direction of price movements. […]
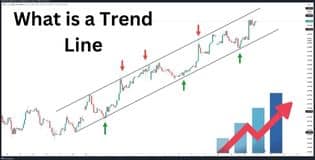
Introduction A Trend Line is a fundamental tool in technical analysis that helps traders identify the direction of price movements. […]
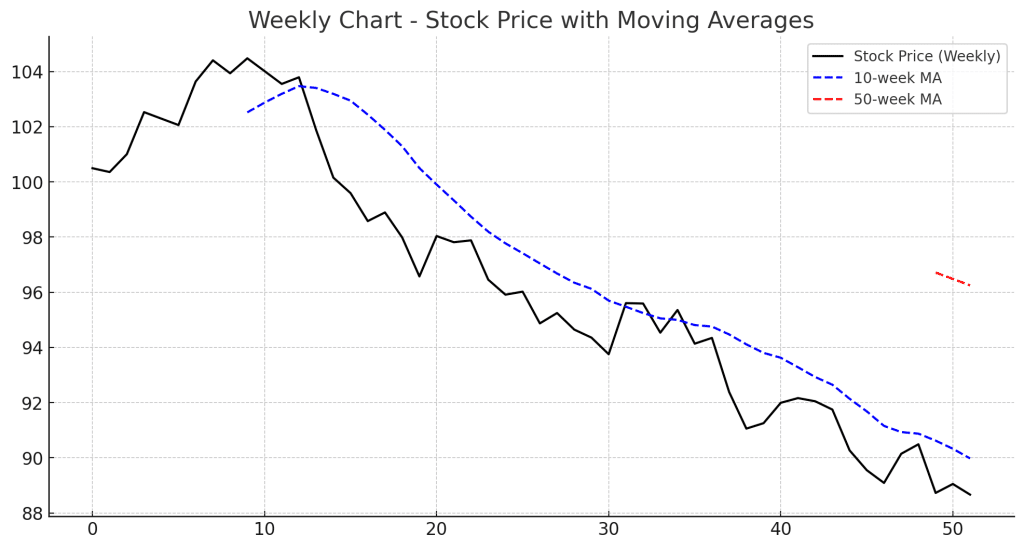
Introduction A Weekly Chart is a type of stock chart that represents price movements over a weekly timeframe. Each candlestick […]
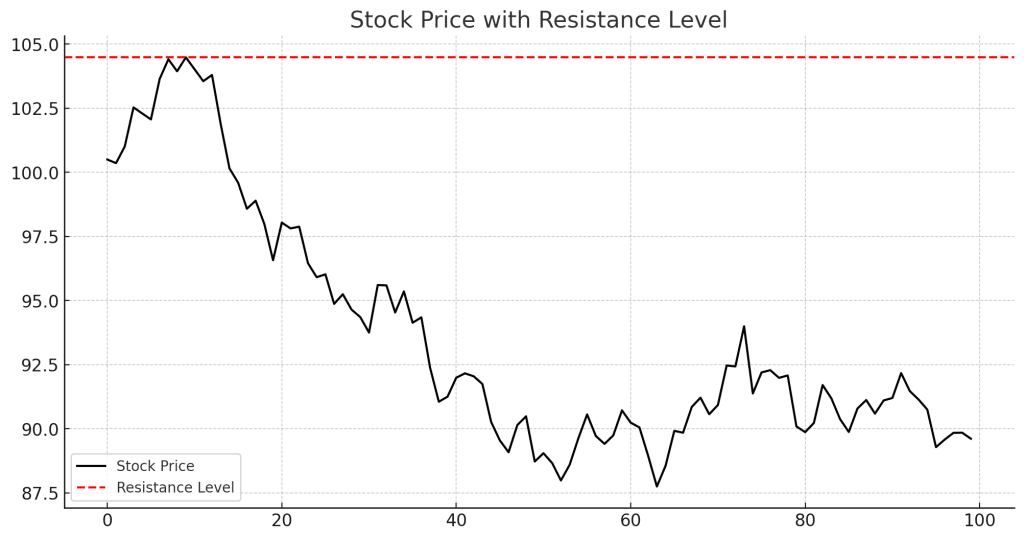
Introduction A Resistance Level is a price point where a stock or asset struggles to move above. It is formed […]
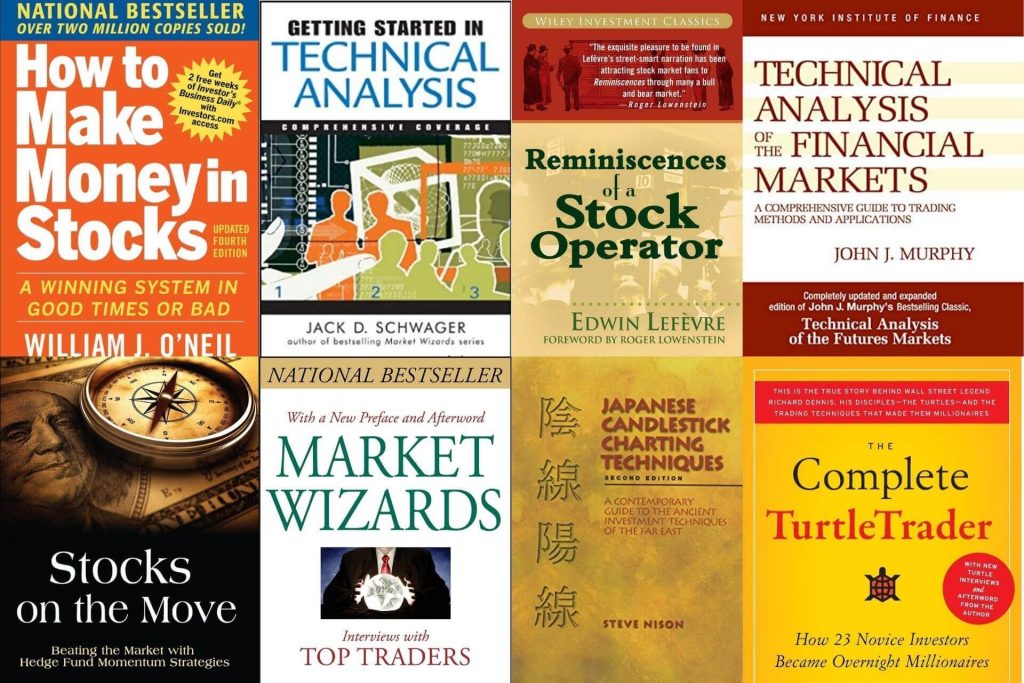
Finding the best stock trading books can be overwhelming, especially with so many options claiming to unlock market success. While […]
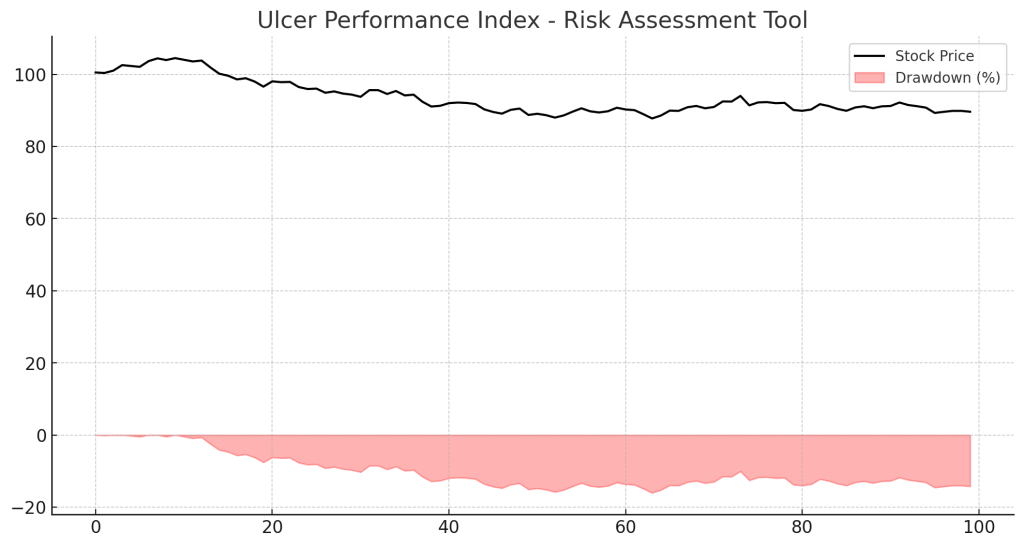
Introduction The Ulcer Performance Index (UPI) is a financial metric that evaluates an investment’s risk-adjusted return by focusing on drawdowns […]
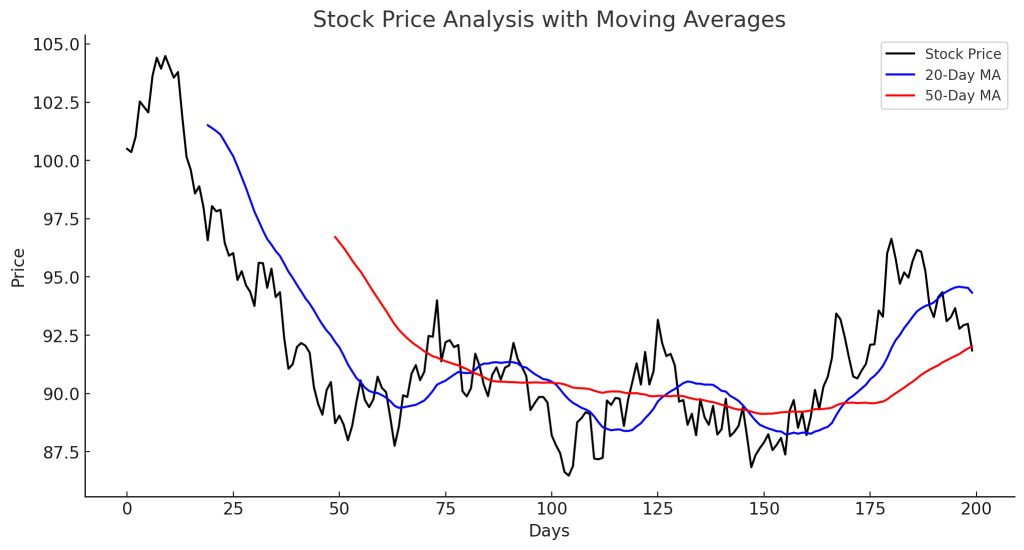
Introduction Stock analysis is a crucial process for investors and traders to evaluate a company’s financial health, performance, and future […]
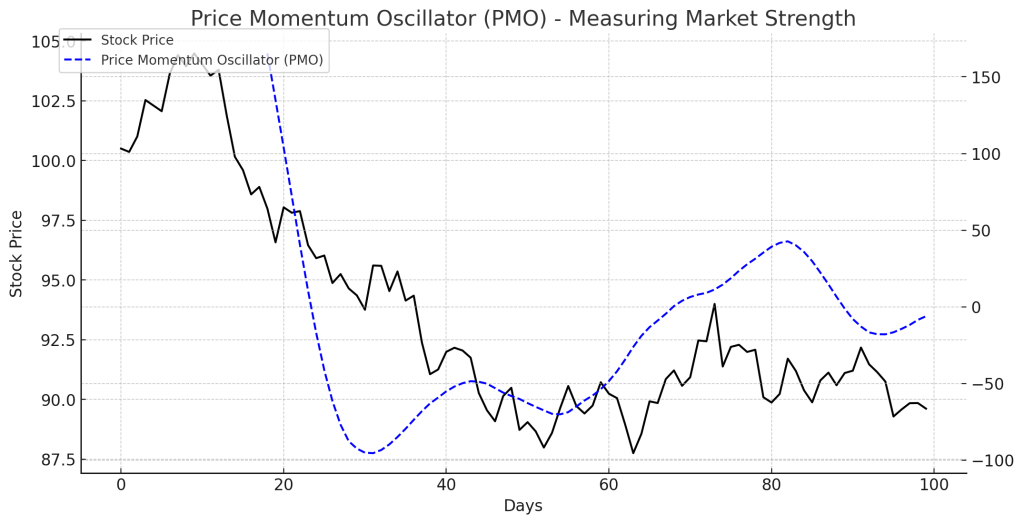
Introduction The Price Momentum Oscillator (PMO) is a powerful technical indicator that helps traders measure market momentum, trend strength, and […]

Introduction Option charts are essential tools for traders who want to analyze option price movements, track implied volatility, and assess […]
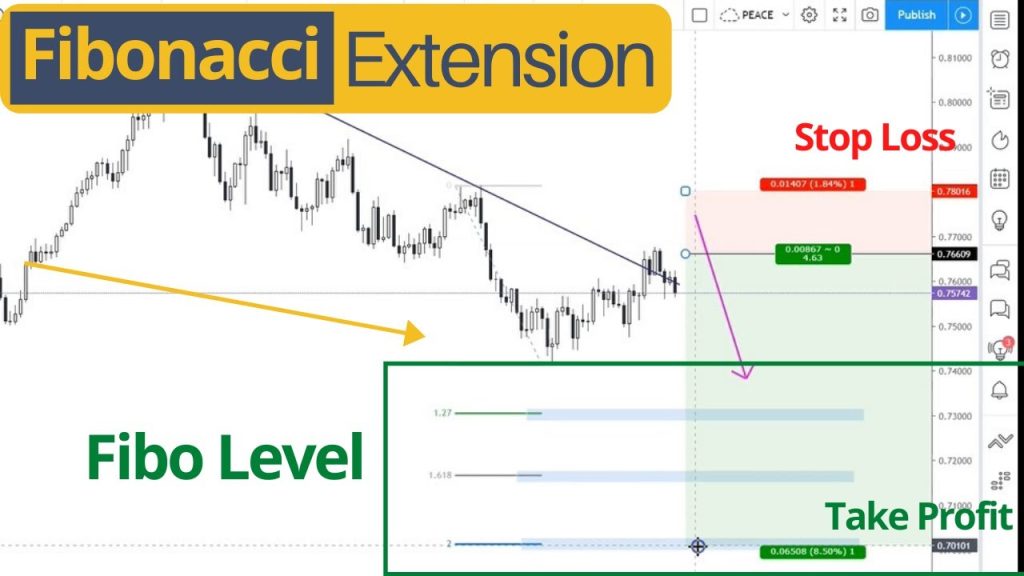
Fibonacci Extensions are a technical analysis tool used by traders to identify potential support and resistance levels beyond the standard […]

Advance-Decline Theory is a technical analysis approach used to assess the overall health of the stock market by measuring the […]