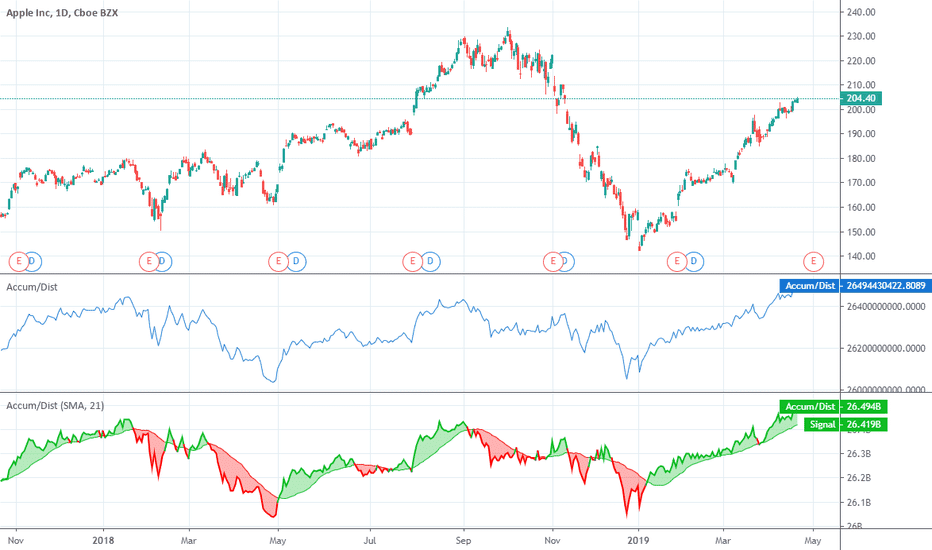
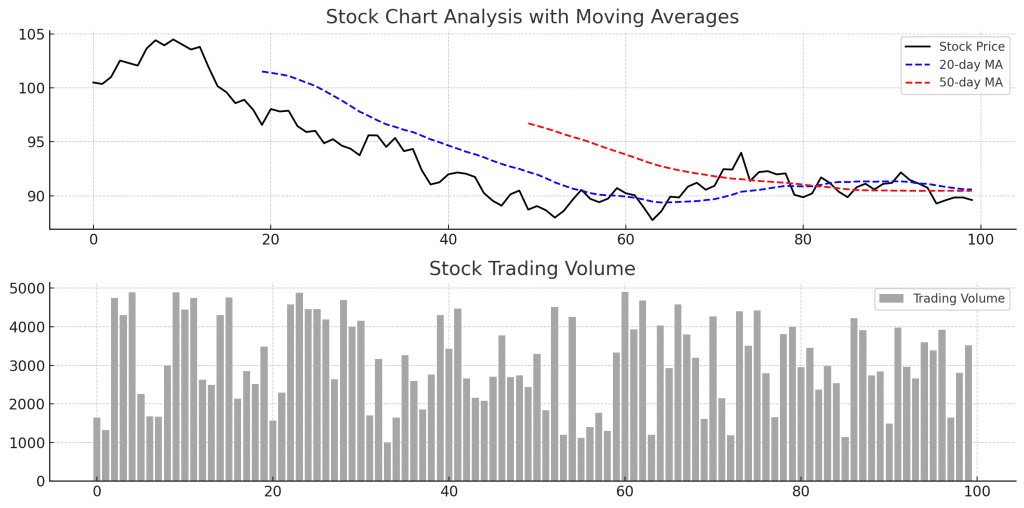
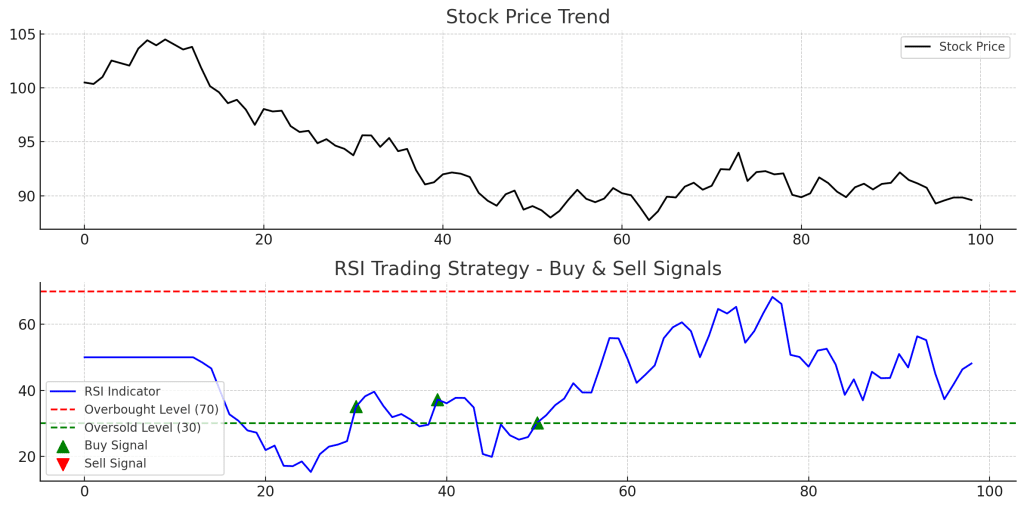
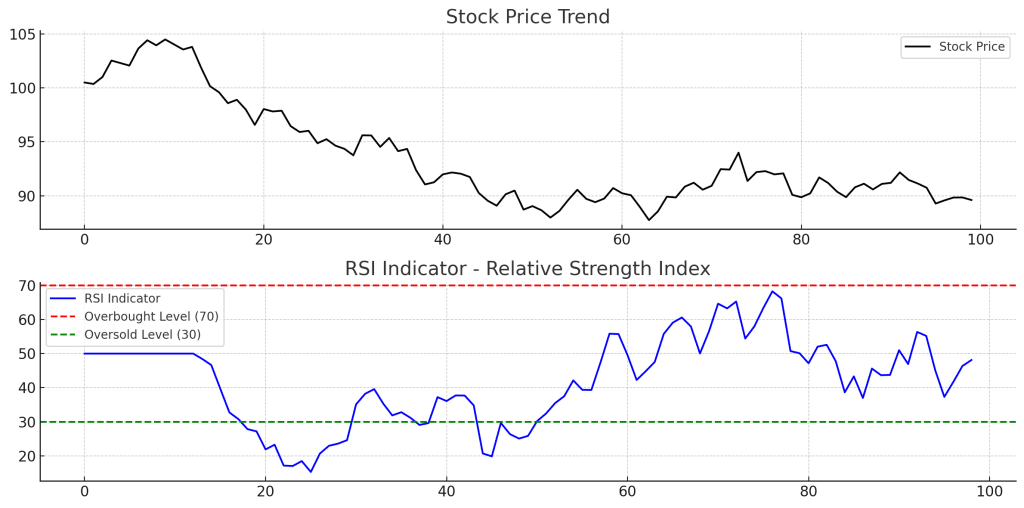
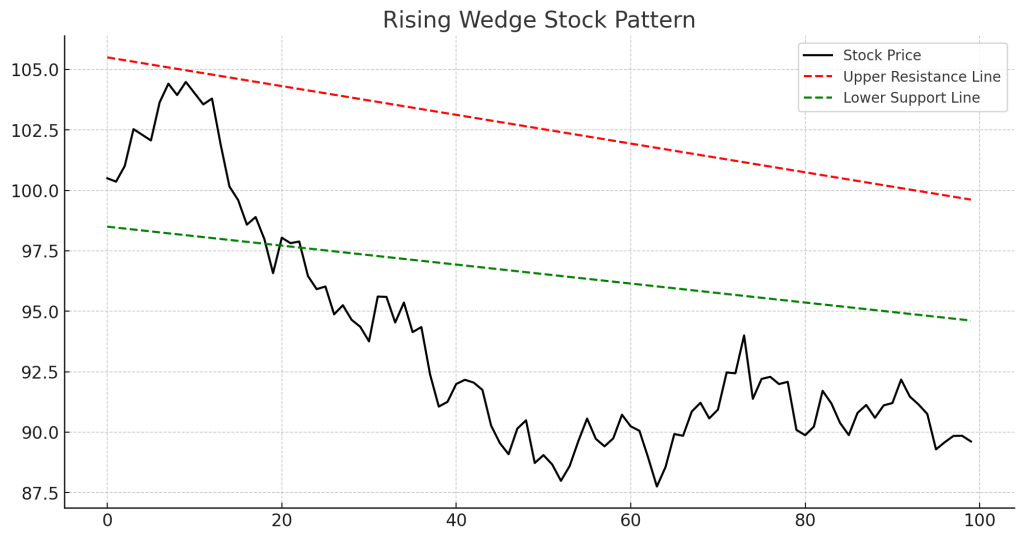
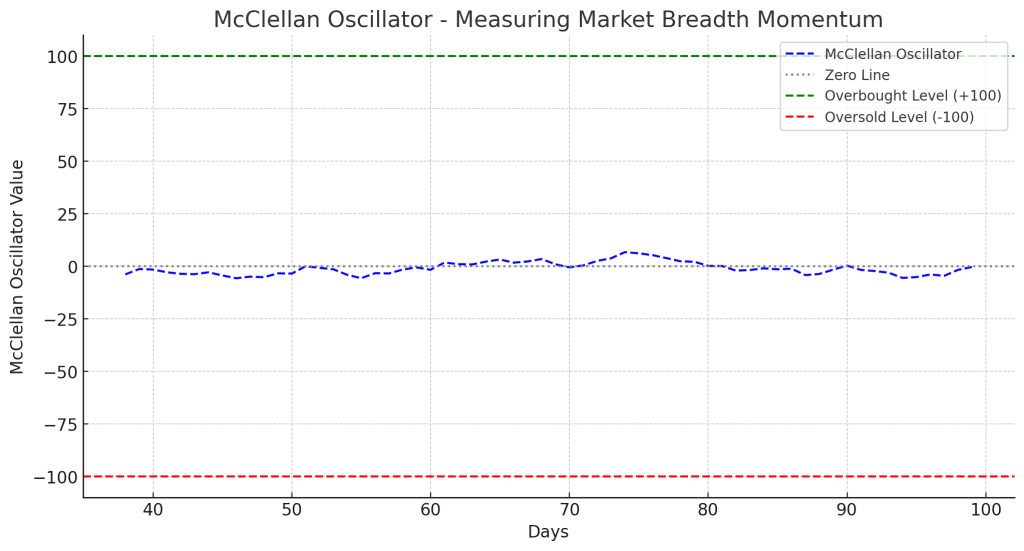
vijay kumar August 16, 2025 Understanding the Double Top Pattern: A Key Indicator of Trend Reversal The double top pattern is a bearish reversal chart pattern that signals a potential shift from an uptrend to a Read More vijay kumar August 15, 2025 Understanding the Descending Wedge Pattern: A Powerful Bullish Reversal Signal The descending wedge pattern, also known as the falling wedge, is a technical analysis chart pattern that typically indicates a Read More vijay kumar August 14, 2025 Understanding the Descending Triangle Pattern: A Key Tool in Technical Analysis Introduction In the realm of technical analysis, chart patterns serve as essential tools for traders and investors to predict potential Read More vijay kumar August 13, 2025 Alligator Indicator: A Powerful Tool for Identifying Trends and Market Reversals The Alligator Indicator, developed by renowned trader and author Bill Williams, is a technical analysis tool designed to identify market Read More vijay kumar August 12, 2025 Accumulation/Distribution (A/D) Indicator: Analyzing Market Strength Through Price and Volume The Accumulation/Distribution (A/D) Indicator is a volume-based technical analysis tool developed to assess the cumulative flow of money into and Read More vijay kumar August 11, 2025 Stock Chart Analysis: Understanding Price Trends and Patterns Introduction Stock Chart Analysis is a crucial skill for traders and investors to interpret price movements and identify potential trading Read More vijay kumar August 10, 2025 SAR Indicator: Understanding the Parabolic Stop and Reverse System Introduction The SAR Indicator (Stop and Reverse), also known as the Parabolic SAR, is a technical analysis tool developed by Read More vijay kumar August 9, 2025 RSI Trading Strategy: Using the Relative Strength Index for Profitable Trades Introduction The RSI Trading Strategy is a popular approach among traders who use the Relative Strength Index (RSI) to identify Read More vijay kumar August 8, 2025 RSI Indicator: A Powerful Tool for Momentum Analysis Introduction The RSI Indicator (Relative Strength Index) is a momentum oscillator used in technical analysis to measure the speed and Read More vijay kumar August 7, 2025 RSI Formula: How to Calculate the Relative Strength Index Introduction The Relative Strength Index (RSI) is a momentum oscillator used in technical analysis to measure the strength of price Read More vijay kumar August 6, 2025 Rising Wedge Stock Pattern: A Bearish Reversal Formation Introduction The Rising Wedge Stock Pattern is a bearish chart pattern that signals a potential downtrend reversal. It occurs when Read More vijay kumar August 5, 2025 McClellan Oscillator: A Momentum Indicator for Market Breadth Analysis Introduction The McClellan Oscillator is a market breadth momentum indicator that helps traders assess the strength of market trends and Read More Previous Page1 Page2 Page3 Page4 Page5 Page6 Page7 Page8 Page9 Page10 Page11 Page12 Page13 Page14 Page15 Page16 Page17 Page18 Page19 Page20 Page21 Page22 Page23 Page24 Page25 Page26 Page27 Page28 Page29 Page30 Page31 Page32 Page33 Page34 Page35 Page36 Page37 Page38 Page39 Page40 Next