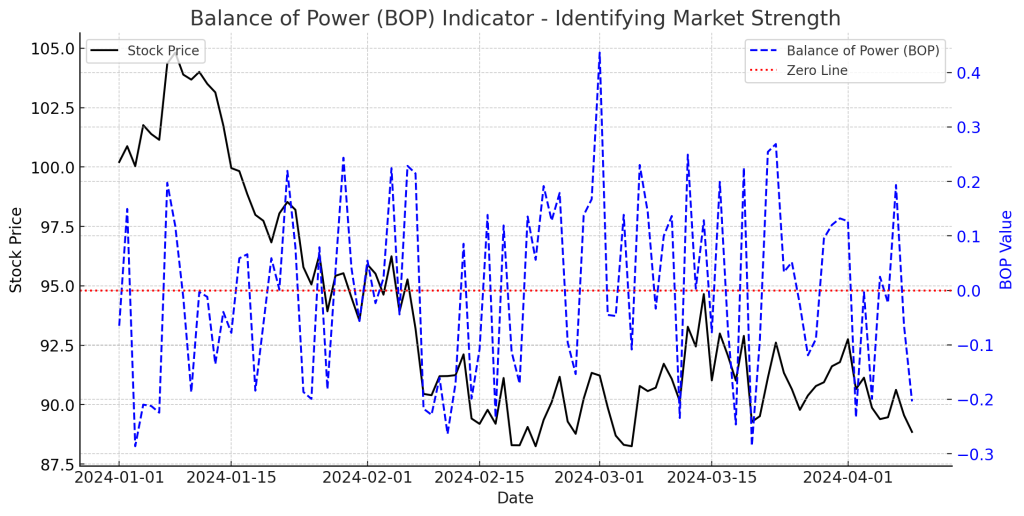
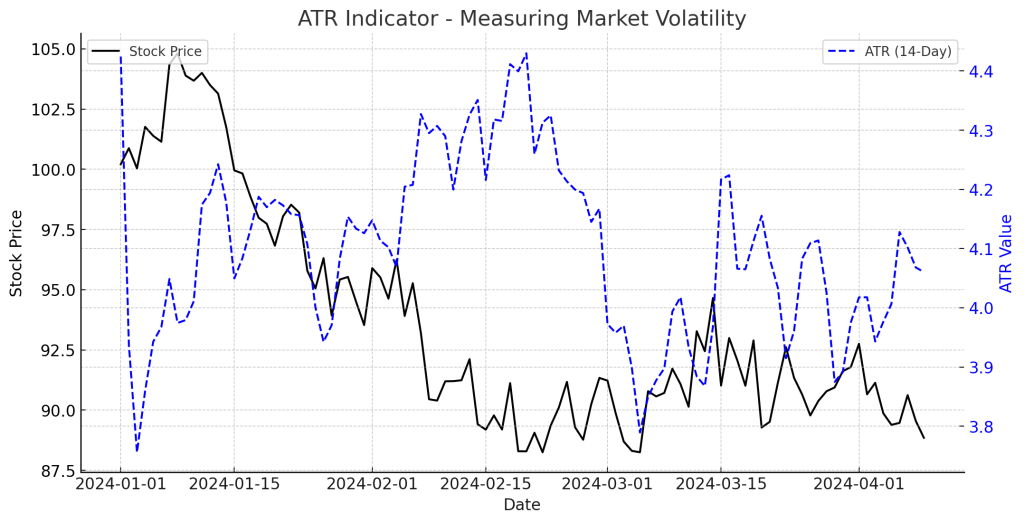
vijay kumar May 15, 2025 How Much Do Swing Traders Make? Income Potential Explained Swing trading is a popular trading strategy that sits between day trading and long-term investing. But many aspiring traders often Read More vijay kumar May 15, 2025 How Is Futures Trading Taxed in the U.S.? A 2025 Guide How Futures Trading is Taxed in the U.S.: Section 1256 Explained Futures trading can deliver substantial profits—but when tax season Read More vijay kumar May 15, 2025 Free Software for Stock Analysis: Top Picks for Traders in 2025 Stock analysis no longer requires expensive tools. Today, several platforms offer free software for stock analysis, packed with powerful features Read More vijay kumar May 14, 2025 BOP Indicator: Measuring Buying and Selling Pressure Introduction The Balance of Power (BOP) Indicator is a technical tool that helps traders evaluate the strength of buyers versus Read More vijay kumar May 14, 2025 Bollinger Band Squeeze: Identifying Breakout Opportunities Introduction The Bollinger Band Squeeze is a powerful technical analysis strategy that signals low volatility phases before major price movements. Read More vijay kumar May 14, 2025 Bearish Reversal Patterns: Identifying Market Downturns Introduction Bearish reversal patterns are technical formations that signal a shift from an uptrend to a downtrend. Traders use these Read More vijay kumar May 13, 2025 Bearish Chart Patterns: Spotting Market Downtrends Bearish Chart Patterns: Spotting Market Downtrends Introduction Bearish chart patterns are technical formations that signal trend reversals or downtrend continuations. Read More vijay kumar May 13, 2025 Bearish Candlestick Patterns: Identifying Market Downturns Introduction Bearish candlestick patterns are key indicators of potential trend reversals or downtrends in the stock, forex, and crypto markets. Read More vijay kumar May 13, 2025 Balance of Power Indicator: Measuring Buying and Selling Strength Introduction The Balance of Power (BOP) Indicator is a technical analysis tool that helps traders measure the buying and selling Read More vijay kumar May 12, 2025 Ascending Triangle Pattern: A Bullish Continuation Signal Introduction The Ascending Triangle Pattern is a bullish continuation chart pattern that signals a potential breakout to the upside. It Read More vijay kumar May 12, 2025 ATR Indicator: Understanding Average True Range for Volatility Analysis Introduction The Average True Range (ATR) Indicator is a key tool in technical analysis used to measure market volatility. Unlike Read More vijay kumar May 12, 2025 ThinkorSwim: A Powerful Trading Platform for Active Traders ThinkorSwim (TOS) is a professional-grade trading platform developed by TD Ameritrade (now part of Charles Schwab). It offers advanced charting, Read More Previous Page1 Page2 Page3 Page4 Page5 Page6 Page7 Page8 Page9 Page10 Page11 Page12 Page13 Page14 Page15 Page16 Page17 Page18 Page19 Page20 Page21 Page22 Page23 Page24 Page25 Page26 Page27 Page28 Page29 Page30 Page31 Page32 Page33 Page34 Page35 Page36 Page37 Page38 Page39 Page40 Next