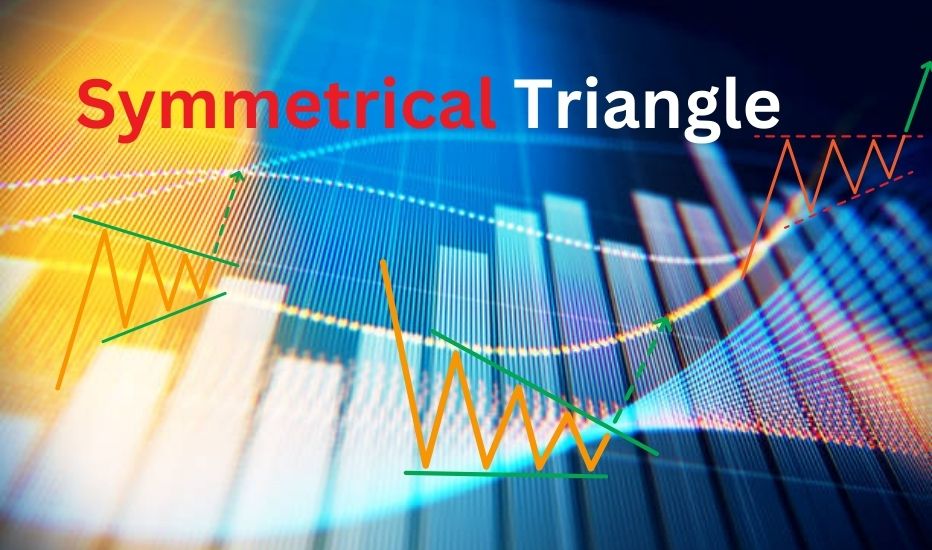
The Symmetrical Triangle is a common chart pattern that signals a potential breakout in either direction. It forms when price
Introduction The Kaufman’s Adaptive Moving Average (KAMA) is a unique moving average designed to adjust dynamically to market conditions. Unlike
Introduction The Inverse Head and Shoulders pattern is one of the most reliable bullish reversal patterns in technical analysis. It
Introduction The Institutional Money Flow Indicator (IMFI) helps traders track the movements of big money players, such as hedge funds,
Introduction Candlestick chart patterns are essential tools for traders to interpret market sentiment, trend reversals, and potential price movements. Originating
Introduction Bullish reversal candlestick patterns signal a potential shift from a downtrend to an uptrend. These formations appear at key
IntroductionThe Bullish Percent Index is a valuable tool for investors looking to gauge market trends. Understanding this index can help
Introduction Bullish harmonic patterns are advanced chart formations that help traders predict price reversals with greater precision. These patterns use
Bullish Flag Pattern: A Continuation Signal for Strong Uptrends Introduction The Bullish Flag Pattern is a powerful continuation pattern that
Introduction Bullish candlestick patterns help traders recognize trend reversals and buying opportunities in the stock, forex, and crypto markets. These
Investing in undervalued stocks is a classic strategy used by value investors like Warren Buffett. When learning how to identify
Finding trending stocks can give traders and investors an edge in fast-moving markets. Whether you’re swing trading, day trading, or


