Traffic Light Indicator: A Simple Yet Powerful Trading Tool
The Traffic Light Indicator is a visual trading tool that helps traders quickly assess market conditions using a color-coded system—just like a real traffic light. This indicator simplifies decision-making by signaling when to buy, hold, or sell based on price trends and momentum.
In this article, we’ll explore how the Traffic Light Indicator works, how to use it for trading, and how it compares to other technical indicators.
1. What is the Traffic Light Indicator?
The Traffic Light Indicator is a trend-based indicator that assigns colors to market conditions:
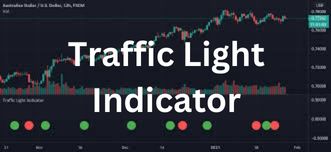
- 🟢 Green (Go) – Bullish trend (strong buy signal).
- 🟡 Yellow (Caution) – Sideways market or trend weakening (hold or wait).
- 🔴 Red (Stop) – Bearish trend (strong sell signal).
It helps traders avoid emotional trading by providing clear entry and exit signals.
2. How the Traffic Light Indicator Works
The Traffic Light Indicator is often based on a combination of moving averages, momentum indicators, and trend strength.
📌 Typical Calculation Factors:
✔ Moving Averages (e.g., 20 EMA, 50 EMA, 200 EMA) – Identify trend direction.
✔ Relative Strength Index (RSI) – Measures momentum and overbought/oversold levels.
✔ MACD (Moving Average Convergence Divergence) – Confirms trend strength.
📌 Color Coding System:
✔ Green – Price is above key moving averages, and momentum is positive.
✔ Yellow – Price is consolidating, or momentum is weakening.
✔ Red – Price is below key moving averages, and momentum is negative.
3. How to Use the Traffic Light Indicator in Trading
A. Buy and Sell Strategy
✔ Buy when the indicator turns Green – Confirms a strong uptrend.
✔ Hold or wait when the indicator turns Yellow – Market is uncertain.
✔ Sell when the indicator turns Red – Confirms a strong downtrend.
B. Stop-Loss and Take-Profit Placement
✔ Place a stop-loss below the most recent support level when entering a Green signal trade.
✔ Take profits when the indicator shifts from Green to Yellow or Red.
C. Combining with Other Indicators
✔ Traffic Light + RSI – Helps confirm trend strength.
✔ Traffic Light + MACD – Confirms momentum shifts.
✔ Traffic Light + Bollinger Bands – Identifies breakout opportunities.
4. Example of the Traffic Light Indicator in Action
📌 Bullish Example (Buy Signal)
- Stock is trading above the 50-day EMA.
- RSI is above 50, and MACD is bullish.
- The indicator turns Green → Buy signal.
📌 Bearish Example (Sell Signal)
- Stock is trading below the 50-day EMA.
- MACD shows a bearish crossover.
- The indicator turns Red → Sell signal.
5. Advantages of the Traffic Light Indicator
✔ Easy to Understand – Simple color-coded system.
✔ Works Across Markets – Can be used for stocks, forex, and crypto.
✔ Filters Noise – Helps avoid false signals.
✔ Reduces Emotional Trading – Provides clear entry/exit points.
6. Traffic Light Indicator vs Other Indicators
| Feature | Traffic Light Indicator | Moving Averages | RSI | MACD |
|---|---|---|---|---|
| Visual Simplicity | ✅ High | ❌ Low | ❌ Low | ❌ Low |
| Trend Identification | ✅ Yes | ✅ Yes | ❌ No | ✅ Yes |
| Momentum Analysis | ✅ Yes | ❌ No | ✅ Yes | ✅ Yes |
| Buy/Sell Signals | ✅ Clear | ❌ Delayed | ❌ Overbought/Oversold | ✅ Medium |
7. Final Thoughts
This is a simple yet powerful tool that helps traders quickly assess market conditions. By following its colour-coded signals, traders can make informed decisions and avoid emotional trading mistakes.