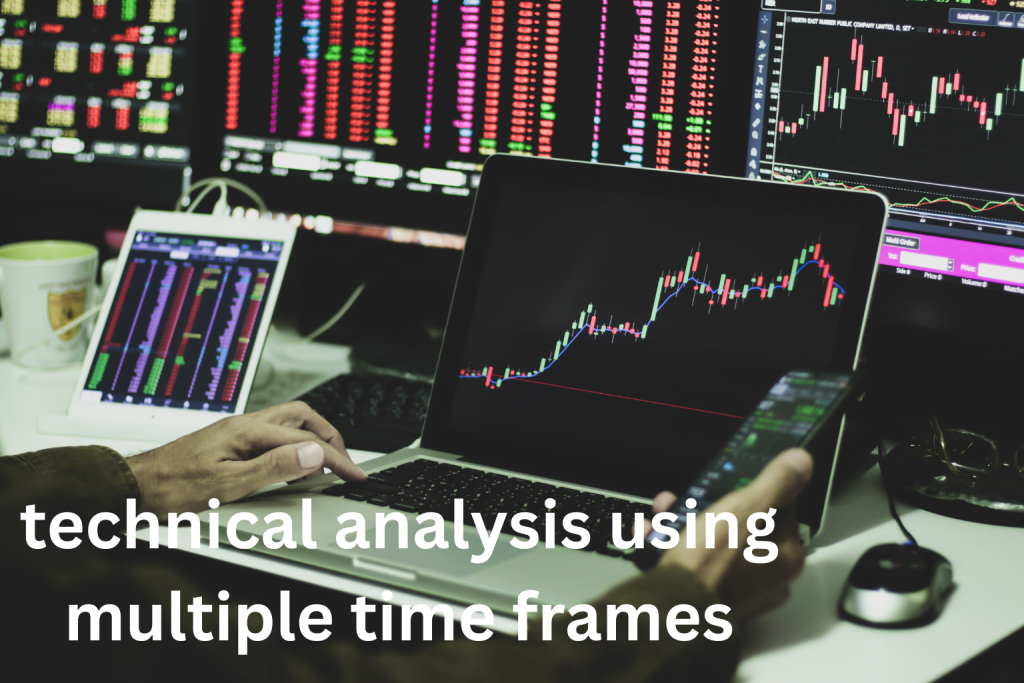
Technical Analysis Using Multiple Time Frames: A Complete Guide

One of the most overlooked yet powerful techniques in trading is technical analysis using multiple time frames. Whether you’re a day trader, swing trader, or long-term investor, checking multiple time frames before entering a trade helps improve timing, clarity, and overall success rate.
What Is Multiple Time Frame Analysis?
Multiple Time Frame Analysis (MTFA) is the practice of analyzing the same asset on different time frames to:
- Understand the bigger picture trend
- Find precise entries/exits on smaller time frames
- Avoid trading against the major trend
Why Use Multiple Time Frames?
- 🧠 Gain broader market context
- ⏳ Fine-tune entries with better precision
- 🚫 Avoid false signals on smaller charts
- ✅ Increase probability of winning trades
Common Time Frame Combinations
| Trader Type | Higher Time Frame | Entry Time Frame |
|---|---|---|
| Day Trader | 1H or 4H | 5m or 15m |
| Swing Trader | Daily | 1H or 4H |
| Position Trader | Weekly | Daily |
The idea is to analyze trend direction on the higher time frame, and execute the trade on the lower time frame when a setup aligns.
Step-by-Step Example: MTFA in Action
Let’s say you’re a swing trader using the Daily and 4-Hour charts:
- Start with Daily Chart
- Identify major trend: Uptrend
- Mark support and resistance zones
- Look for candlestick patterns or moving average confluence
- Move to 4H Chart
- Enter trade
- Place stop-loss below 4H support
- Set target near daily resistance
- Use risk/reward of at least 1:2
Tips for Using Multiple Time Frames
- Use 2–3 time frames max to avoid confusion
- Always begin with the higher time frame to assess direction
- Use lower time frame for timing, not trend judgment
- Look for alignment across time frames—it’s a powerful signal
- Keep indicators consistent to avoid conflicting interpretations
Best Tools for Multi-Time Frame Analysis
- TradingView – Timeframe stacking, multiple windows
- MetaTrader 5 – Custom indicators per chart
- TrendSpider – Automatic trendline detection across time frames
- ThinkorSwim – Time aggregation and shared analysis views
FAQs
Q1. How many time frames should I use in trading?
Two is ideal: one higher (trend), one lower (entry). A third can be used for confirmation if needed.
Q2. Can I use MTFA for intraday trading?
Yes. Use 15m or 5m for entries, with 1H or 4H as the directional trend chart.
Q3. What indicators work best with MTFA?
Moving averages, RSI, MACD, trendlines, and Fibonacci levels translate well across time frames.
Q4. Is this technique suitable for beginners?
Yes. It adds structure and reduces impulsive trading.
Q5. Can MTFA be used in crypto or forex?
Absolutely. It’s effective in any liquid market—stocks, crypto, futures, or forex.