Rate of Change (ROC) Indicator: Measuring Market Momentum

Introduction
The Rate of Change (ROC) Indicator is a momentum oscillator that measures the percentage change in price between the current price and the price a set number of periods ago. Traders use ROC to identify momentum strength, trend reversals, and overbought/oversold conditions.
What is the Rate of Change (ROC) Indicator?
ROC calculates the speed at which a stock’s price is changing by comparing today’s price to the price N periods ago.
Formula for ROC Calculation
Where:
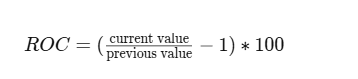
- Current Price = Latest closing price.
- Price N Periods Ago = Closing price from N periods earlier.
- N = Number of periods (e.g., 10-day ROC, 14-day ROC).
How to Interpret the ROC Indicator
- Positive ROC (> 0):
- Price is increasing, indicating bullish momentum.
- Higher ROC values suggest strong buying pressure.
- Negative ROC (< 0):
- Price is decreasing, indicating bearish momentum.
- Lower ROC values suggest strong selling pressure.
- Overbought and Oversold Conditions:
- ROC above +10% indicates an overbought market.
- ROC below -10% indicates an oversold market.
- Divergence Signals:
- Bullish Divergence: Price is making lower lows, but ROC is making higher lows → Possible reversal upward.
- Bearish Divergence: Price is making higher highs, but ROC is making lower highs → Possible reversal downward.
Trading Strategies Using ROC
1. Trend Confirmation Strategy
- If ROC is rising and remains positive, it confirms an uptrend.
- If ROC is falling and remains negative, it confirms a downtrend.
2. Overbought/Oversold Strategy
- Sell when ROC reaches extreme high levels (+10% or more).
- Buy when ROC reaches extreme low levels (-10% or less).
3. Divergence Trading Strategy
- Bullish Divergence: Enter long trades when ROC moves up while price declines.
- Bearish Divergence: Enter short trades when ROC moves down while price rises.
Example of a ROC Trade
- A stock’s 10-day ROC moves above +10%, signaling strong buying momentum.
- The trader enters a long position, riding the uptrend until ROC flattens out.
- The trader exits the trade when ROC starts declining, indicating weakening momentum.
Advantages of Using the ROC Indicator
- Easy to Use: A simple and effective momentum indicator.
- Works in Trend and Reversal Trading: Helps traders confirm trends and spot divergences.
- Applies to Multiple Timeframes: Useful for day trading, swing trading, and long-term investing.
Limitations
- High Sensitivity to Market Noise: ROC can generate false signals in choppy markets.
- Requires Additional Confirmation: Best used alongside RSI, MACD, or moving averages.
Conclusion
The Rate of Change (ROC) Indicator is an effective tool for measuring momentum strength and price acceleration. By combining ROC with trend analysis and divergence detection, traders can improve their trade accuracy and market timing.