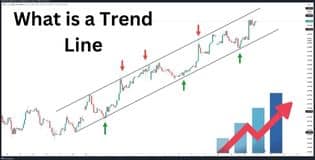
What is a Trend Line?
Introduction
A Trend Line is a fundamental tool in technical analysis that helps traders identify the direction of price movements. It is drawn on a price chart to connect key price points, providing a visual representation of market trends.
Understanding Trend Lines
Trend lines act as support and resistance levels, showing the overall price direction and potential reversal points. They are used to analyze market movements in stocks, forex, crypto, and commodities.
Types of Trend Lines
- Uptrend Line (Bullish Trend)
- Formed by connecting higher lows in a rising market.
- Indicates that buyers are in control, and prices are likely to rise further.
- Downtrend Line (Bearish Trend)
- Formed by connecting lower highs in a declining market.
- Suggests that sellers are dominant, and prices may continue falling.
- Sideways Trend (Consolidation)
- Occurs when prices move within a horizontal range.
- Indicates market indecision before a breakout in either direction.
How to Draw a Trend Line
- For an uptrend, draw a line connecting at least two higher lows.
- For a downtrend, connect at least two lower highs.
- The more times a trend line is tested and holds, the stronger it becomes.
How Traders Use Trend Lines
- Identifying Support and Resistance
- Prices tend to bounce off trend lines, creating buying or selling opportunities.
- Trend Confirmation
- If prices stay above an uptrend line, it confirms a bullish trend.
- If prices stay below a downtrend line, it confirms a bearish trend.
- Breakout Trading Strategy
- When price breaks above a downtrend line, it may signal a bullish reversal.
- When price breaks below an uptrend line, it may indicate a bearish trend.
Example of Trend Line Trading
- Suppose a stock is in an uptrend, and the price repeatedly bounces off the trend line.
- If price breaks below the trend line, traders may anticipate a reversal and prepare to sell.
Advantages of Using Trend Lines
- Simple and Effective: Easy to identify key market trends.
- Helps in Trade Planning: Provides clear entry and exit points.
- Works in All Markets: Used in stocks, forex, and crypto trading.
Limitations
- Not Always Accurate: Trend lines may be subjective.
- False Breakouts: Prices sometimes break trend lines but fail to follow through.
Conclusion
A Trend Line is a powerful tool in technical analysis, helping traders identify trends, support/resistance levels, and breakout opportunities. By combining trend lines with other indicators like RSI, MACD, and moving averages, traders can improve their market predictions.
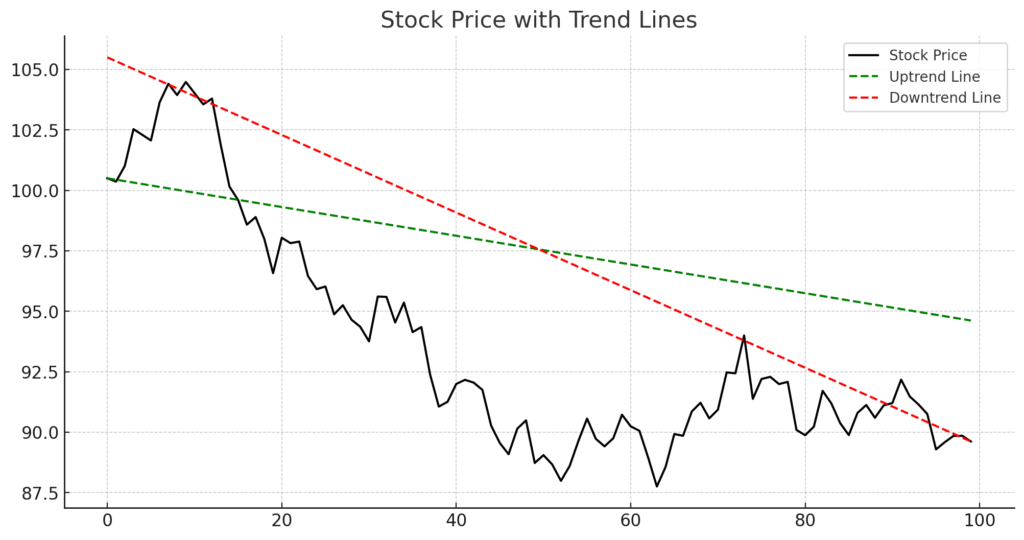
Trend Line Chart Example
Below is a real chart illustrating trend lines in stock price movements: