Symmetrical Triangle: A Powerful Chart Pattern for Traders

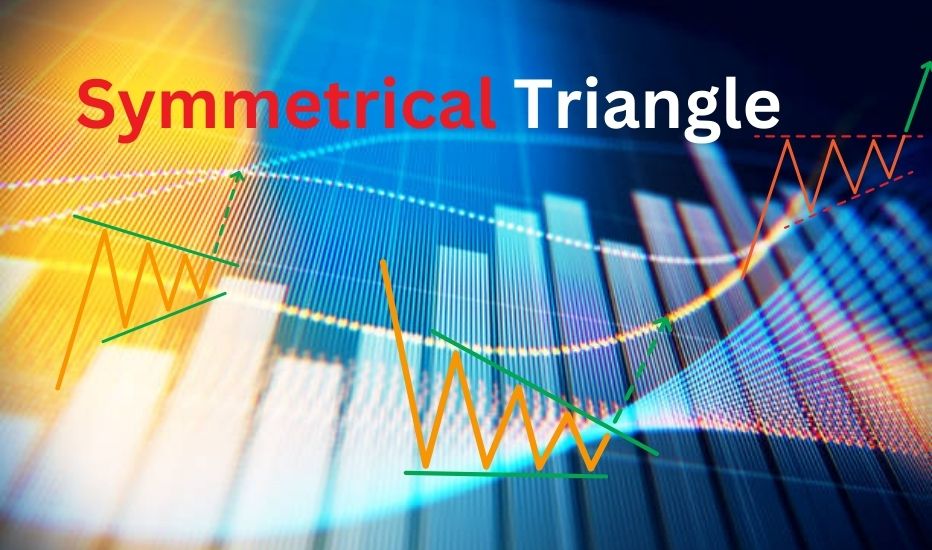
The Symmetrical Triangle is a common chart pattern that signals a potential breakout in either direction. It forms when price consolidates within converging trendlines, creating a triangle shape. This pattern appears in stocks, forex, and crypto markets, and traders use it to anticipate strong price movements once a breakout occurs.
How to Identify a Symmetrical Triangle
✔ Two converging trendlines – a series of lower highs and higher lows.
✔ Volume typically decreases as price moves toward the triangle’s apex.
✔ Breakout can occur in either direction – traders watch for confirmation.
This pattern suggests that buyers and sellers are in a standoff, and once a breakout happens, momentum picks up in the breakout direction.
How to Trade the Symmetrical Triangle
1. Identify the Pattern Formation
- Look for at least two higher lows and two lower highs forming a triangle.
- The price should be squeezed between the trendlines, creating consolidation.
2. Wait for a Breakout
- Bullish Breakout: Price breaks above the upper trendline, signaling an uptrend.
- Bearish Breakout: Price breaks below the lower trendline, signaling a downtrend.
- Always confirm the breakout with high volume for reliability.
3. Enter a Trade
- Buy Signal: If price breaks above resistance, enter a long position.
- Sell Signal: If price breaks below support, enter a short position.
4. Set Stop Loss & Profit Target
- Stop Loss: Place below the breakout candle for long trades and above for short trades.
- Profit Target: Measure the height of the triangle and project it from the breakout point.
Example of a Symmetrical Triangle in Action
Imagine a stock is trading within a $50 – $60 range, forming lower highs and higher lows. As price nears $55, the triangle tightens. A breakout above $58 with high volume confirms a bullish breakout, and the projected target is $68 ($60 – $50 height added to $58 breakout point).
Why is the Symmetrical Triangle Important?
✔ Predicts major price movements with clear breakout signals.
✔ Works across all timeframes for day traders and long-term investors.
✔ Combines well with indicators like RSI, MACD, and volume analysis for confirmation.
Final Thoughts
The Symmetrical Triangle is a powerful and reliable chart pattern that signals strong breakouts. However, traders should always wait for confirmation with volume before entering a trade. Combining it with technical indicators and proper risk management increases the chances of success.