Stock Analysis: Understanding the Market for Better Investments
Introduction
Stock analysis is a crucial process for investors and traders to evaluate a company’s financial health, performance, and future growth potential. It helps in making informed decisions about buying, holding, or selling stocks. There are two main approaches to stock analysis: Fundamental Analysis and Technical Analysis.
1. Fundamental Analysis
Fundamental analysis assesses a company’s intrinsic value by examining various economic, financial, and qualitative factors.
Key Components of Fundamental Analysis
- Financial Statements: Investors analyze the balance sheet, income statement, and cash flow statement to assess profitability and financial health.
- Earnings Reports: Quarterly and annual earnings reports give insights into a company’s revenue, expenses, and net income.
- Key Ratios:
- Price-to-Earnings (P/E) Ratio: Measures a company’s valuation compared to its earnings.
- Debt-to-Equity Ratio: Indicates financial leverage and stability.
- Return on Equity (ROE): Measures profitability relative to shareholder equity.
- Industry & Economic Trends: Macroeconomic factors, such as interest rates and inflation, impact stock performance.
Pros of Fundamental Analysis
- Suitable for long-term investing
- Helps identify undervalued or overvalued stocks
- Provides insight into company stability and growth potential
Cons of Fundamental Analysis
- Time-consuming and complex
- Less effective for short-term trading
- External factors like market sentiment can override fundamentals
2. Technical Analysis
Technical analysis focuses on historical price data, chart patterns, and technical indicators to predict future price movements.
Key Components of Technical Analysis
- Price Charts: Includes candlestick charts, line charts, and bar charts.
- Trend Analysis: Identifies uptrends, downtrends, and sideways trends.
- Support & Resistance Levels: Helps determine price points where a stock may reverse.
- Technical Indicators:
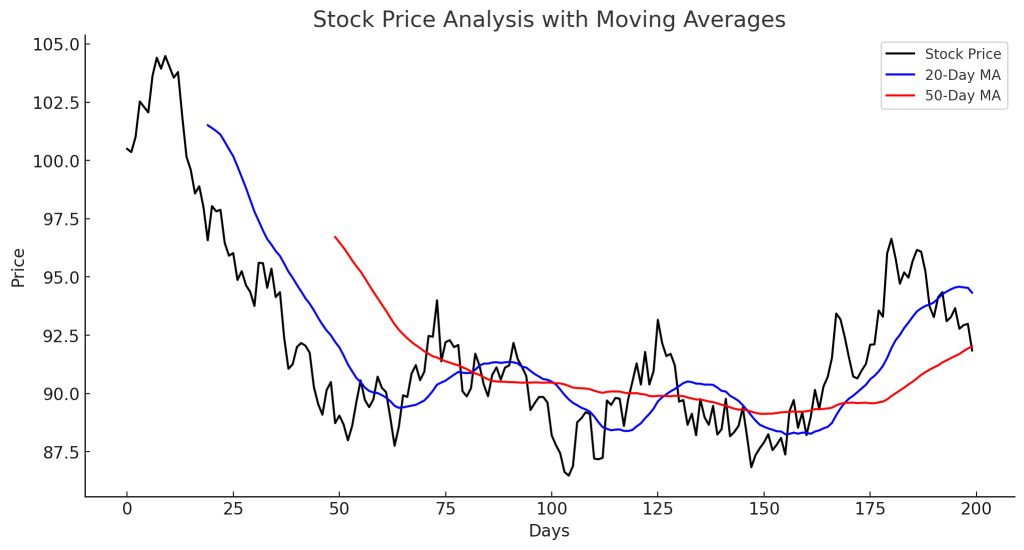
- Moving Averages (SMA, EMA): Tracks stock trends over time.
- Relative Strength Index (RSI): Measures overbought or oversold conditions.
- MACD (Moving Average Convergence Divergence): Identifies trend direction and momentum.
- Bollinger Bands: Indicates volatility and potential breakouts.
Pros of Technical Analysis
- Ideal for short-term trading and timing the market
- Helps identify entry and exit points
- Can be applied across various assets (stocks, forex, crypto)
Cons of Technical Analysis
- May generate false signals in volatile markets
- Ignores company fundamentals
- Requires experience and continuous monitoring
3. Combining Fundamental & Technical Analysis
Many investors use a hybrid approach that integrates both fundamental and technical analysis to get a comprehensive market view. For example, a trader might identify fundamentally strong stocks and use technical indicators to find the best entry points.
Conclusion
Stock analysis is essential for making informed investment decisions. Whether you prefer fundamental analysis for long-term investing or technical analysis for short-term trades, understanding these methods helps maximize returns while managing risks. A balanced approach combining both strategies can improve investment success.