Seasonality Chart: Understanding Market Cycles and Trends
Introduction
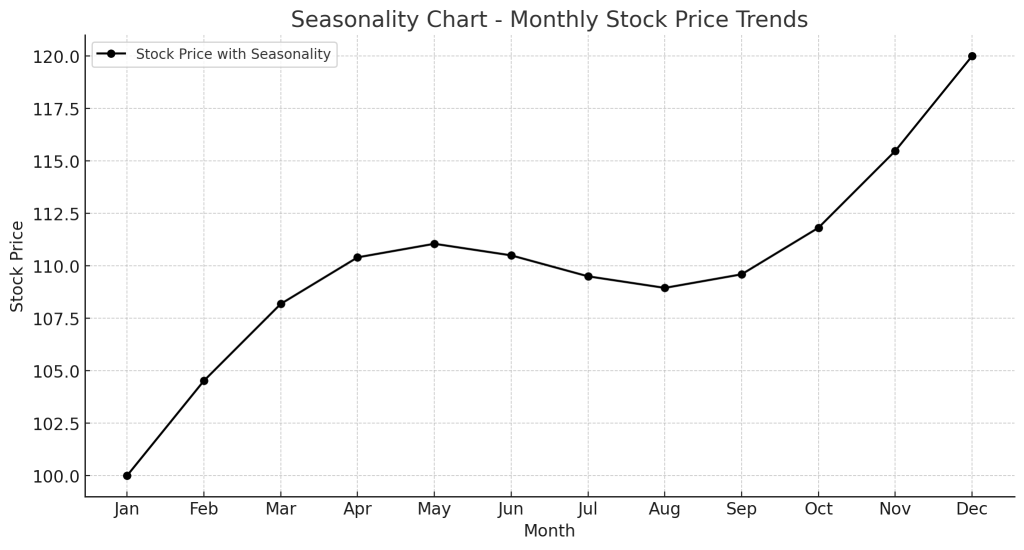
A Seasonality Chart is a graphical representation of recurring price patterns that occur at specific times of the year. Seasonality is a key factor in many financial markets, where price movements exhibit predictable trends based on time periods such as months or quarters.
What is Seasonality in Trading?
Seasonality refers to the tendency of assets to perform better or worse during specific times of the year. This pattern is commonly seen in:
- Stock markets (e.g., “Sell in May and go away” effect).
- Commodities (e.g., oil demand rises in winter, agricultural cycles affect crop prices).
- Retail sales cycles (e.g., holiday season boosts retail stocks).
Key Components of a Seasonality Chart
- Historical Price Trends: Tracks past performance for recurring patterns.
- Monthly or Quarterly Analysis: Highlights the best and worst-performing periods.
- Volume Trends: Shows when trading activity increases or decreases.
- Seasonal Indicators: Identifies bullish and bearish periods.
How to Use a Seasonality Chart in Trading
1. Identifying High and Low Points
- Traders analyze monthly or quarterly trends to spot peak buying and selling periods.
- Example: Stocks often rise in November and December due to the “Santa Rally.”
2. Seasonal Trading Strategies
- Stock Market Strategy: Buy in October and hold through April to capture historical uptrends.
- Commodity Strategy: Trade oil and gas stocks based on seasonal demand fluctuations.
- Forex Strategy: Identify currency trends tied to economic cycles and interest rate shifts.
3. Risk Management with Seasonality
- Investors use seasonality charts to adjust portfolios before market trends shift.
- Example: Reducing stock exposure before historically weak months.
Example of Seasonality in Action
- Suppose a stock has historically gained 5-10% in the first quarter.
- Traders anticipate this trend and adjust their positions accordingly.
- If price patterns deviate from historical trends, it may signal fundamental changes.
Advantages of Using a Seasonality Chart
- Predictable Trends: Helps traders capitalize on recurring price movements.
- Improves Trade Timing: Enhances decision-making by aligning with seasonal strength/weakness.
- Works Across Multiple Markets: Useful for stocks, commodities, forex, and indices.
Limitations
- Not Always Reliable: Seasonal trends can be disrupted by economic events or global crises.
- Should Be Used with Other Indicators: Combining with RSI, MACD, or fundamental analysis improves accuracy.
Conclusion
A Seasonality Chart is an essential tool for traders and investors looking to leverage recurring market trends. By incorporating seasonality analysis into trading strategies, traders can improve trade timing and manage risks effectively.