RSI Indicator: A Powerful Tool for Momentum Analysis
Introduction
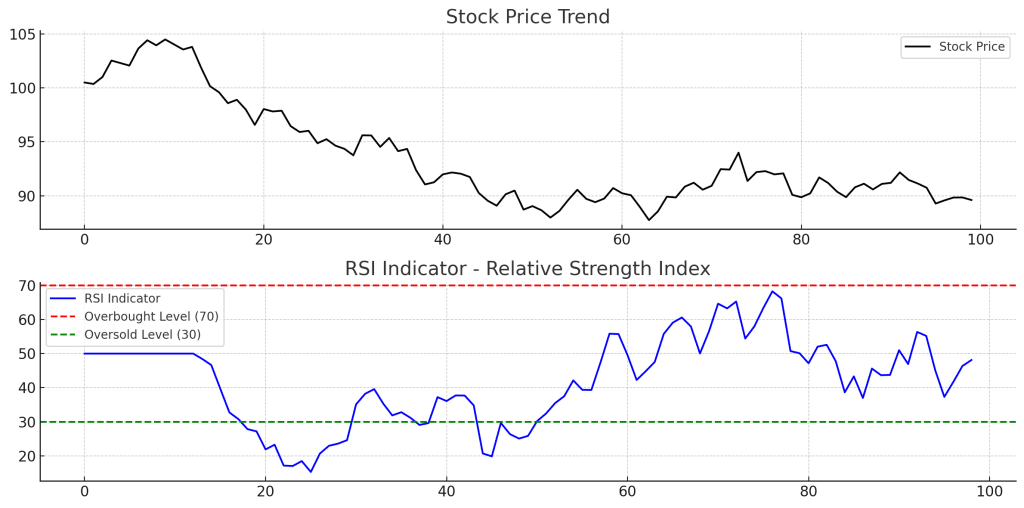
The RSI Indicator (Relative Strength Index) is a momentum oscillator used in technical analysis to measure the speed and strength of price movements. It helps traders identify overbought and oversold conditions, making it a crucial tool for market timing.
Understanding the RSI Indicator
The RSI Indicator fluctuates between 0 and 100 and is calculated using the following formula:
RSI=100−1001+RSRSI = 100 – \frac{100}{1 + RS}
Where RS (Relative Strength) is:
RS=AverageGainovernperiodsAverageLossovernperiodsRS = \frac{Average Gain over n periods}{Average Loss over n periods}
- The default period for RSI is 14 days, though traders may adjust it based on their strategy.
- RSI values above 70 indicate overbought conditions, while values below 30 indicate oversold conditions.
How to Interpret RSI
- Above 70: Overbought – potential reversal or correction.
- Below 30: Oversold – potential buying opportunity.
- Between 50-70: Indicates bullish momentum.
- Between 30-50: Suggests bearish momentum.
Trading Strategies Using RSI Indicator
A trader might:
- Buy when RSI moves above 30 from an oversold condition.
- Sell when RSI moves below 70 from an overbought condition.
- Use RSI Divergences (when price moves opposite to RSI) to spot trend reversals.
Example of RSI Indicator Trading
- Suppose a stock is in a downtrend, and RSI drops below 30.
- If RSI crosses back above 30, it signals a buy opportunity.
- Conversely, if a stock is above 70 and RSI starts declining, it suggests a sell opportunity.
Advantages of RSI Indicator
- Easy to Use: Clearly defined overbought and oversold levels.
- Applicable to Multiple Markets: Used in stocks, forex, and crypto trading.
- Works Well with Other Indicators: Often combined with MACD, Bollinger Bands, and Moving Averages.
Limitations
- False Signals: RSI may remain overbought or oversold in strong trends.
- Requires Confirmation: Best used with volume analysis or trend indicators.
Conclusion
The RSI Indicator is an essential tool for traders analyzing market momentum and price strength. By combining RSI with other technical indicators, traders can improve accuracy and refine their trading strategies.