Resistance Level: A Key Concept in Technical Analysis
Introduction
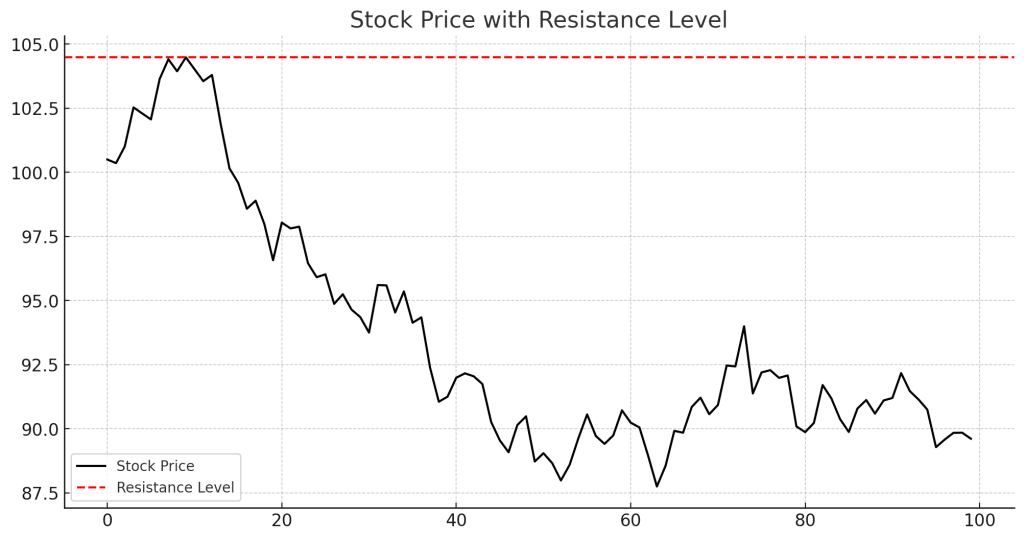
A Resistance Level is a price point where a stock or asset struggles to move above. It is formed when the asset’s price repeatedly fails to break through a certain level, indicating strong selling pressure.
Understanding Resistance Levels
Resistance levels occur when traders start selling at a specific price, preventing further upward movement. They can be identified using technical indicators, historical price action, and chart patterns.
How Resistance Levels Are Identified
- Previous Highs: A resistance level forms when price struggles to break above a past high.
- Moving Averages: The 50-day or 200-day moving averages often act as resistance.
- Trendlines: A downward sloping trendline can indicate dynamic resistance.
- Psychological Levels: Round numbers like $100, $500, or $1000 often act as resistance.
Trading Strategies Using Resistance Levels
A trader might:
- Sell or short when the price approaches resistance, expecting a pullback.
- Wait for a breakout above resistance with high volume before entering a buy position.
- Use stop-loss orders above resistance when short-selling to limit risk.
Example of Resistance Level Trading
- Suppose a stock has historically failed to break above $150.
- If the stock reaches $150 again, traders may expect it to pull back.
- If the stock breaks above $150 with high volume, it may signal a breakout.
Advantages of Resistance Levels
- Helps Identify Sell Zones: Traders can plan exit points near resistance.
- Works with Other Indicators: Often combined with RSI, MACD, or Bollinger Bands.
- Improves Risk Management: Stop-loss levels can be placed near resistance.
Limitations
- False Breakouts: Price may break resistance temporarily but reverse quickly.
- Requires Confirmation: Resistance is stronger when multiple indicators align.
Conclusion
A Resistance Level is a crucial tool in technical analysis, helping traders identify potential reversal points and breakouts. By using trendlines, moving averages, and volume analysis, traders can make better decisions when trading around resistance levels.