Price Momentum Oscillator: Measuring Market Strength and Trend Acceleration
Introduction
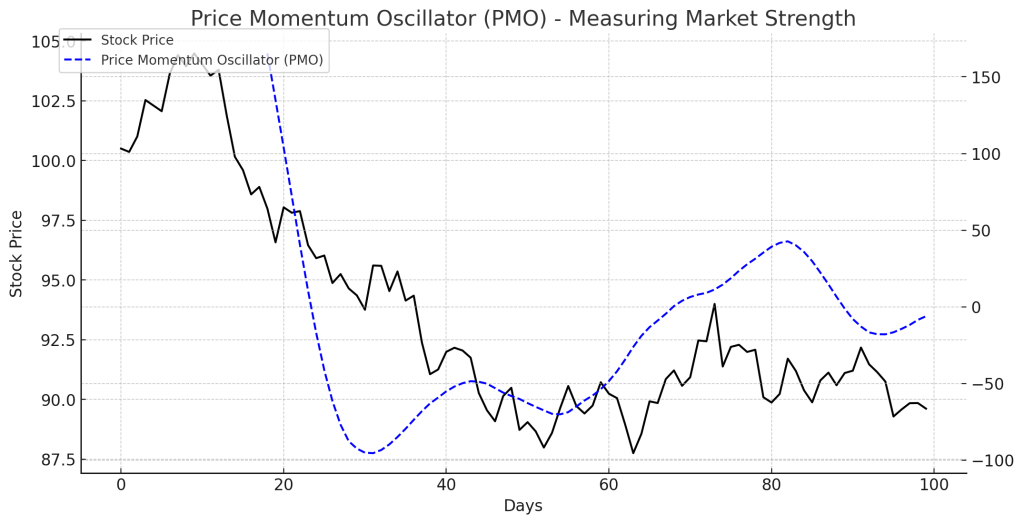
The Price Momentum Oscillator (PMO) is a powerful technical indicator that helps traders measure market momentum, trend strength, and potential reversals. Developed by Carl Swenlin, the PMO is a smoothed momentum oscillator, providing clearer signals compared to standard momentum indicators like the Relative Strength Index (RSI) or the Moving Average Convergence Divergence (MACD).
What is the Price Momentum Oscillator (PMO)?
The PMO is designed to:
- Identify overbought and oversold conditions in the market.
- Confirm trend strength before entering trades.
- Spot divergence signals that indicate upcoming reversals.
It uses a double-smoothed rate-of-change calculation, making it more reliable in filtering market noise.
Formula for the Price Momentum Oscillator
The PMO is calculated in three steps:
- Rate of Change (ROC):
- Smoothing with Exponential Moving Averages (EMAs):
- Apply a 10-period EMA to the ROC value.
- Apply a second 10-period EMA to further smooth the result.
- Final PMO Calculation:
How to Interpret the Price Momentum Oscillator
- Crossovers with the Signal Line:
- Bullish Crossover: When the PMO crosses above its signal line, it signals a potential uptrend.
- Bearish Crossover: When the PMO crosses below its signal line, it signals a potential downtrend.
- Overbought and Oversold Conditions:
- A high PMO value indicates the market is overbought (potential sell signal).
- A low PMO value suggests the market is oversold (potential buy signal).
- Divergence Signals:
- Bullish Divergence: Price is making lower lows, but PMO is making higher lows → Possible trend reversal upward.
- Bearish Divergence: Price is making higher highs, but PMO is making lower highs → Warning of a trend reversal downward.
Trading Strategies Using the PMO
1. Trend Confirmation Strategy
- Enter long trades when the PMO crosses above the signal line and remains positive.
- Enter short trades when the PMO crosses below the signal line and remains negative.
2. Overbought/Oversold Strategy
- Buy when PMO rises from oversold levels (e.g., below -2.5).
- Sell when PMO falls from overbought levels (e.g., above +2.5).
3. Divergence Trading Strategy
- Identify bullish divergence for long positions.
- Spot bearish divergence for short-selling opportunities.
Example of a PMO Trade
- A stock’s PMO crosses above the signal line at a low level.
- The stock price starts an uptrend, confirming the signal.
- The trader enters a long position, riding the trend until the PMO flattens out or crosses below the signal line.
Advantages of Using the PMO
- More Reliable Than Standard Momentum Indicators: Filters out short-term fluctuations.
- Works Well in Trend and Reversal Trading: Provides signals for both trend confirmation and divergence spotting.
- Smooths Out Market Noise: Uses double EMA smoothing for accurate signals.
Limitations
- Lags in Highly Volatile Markets: Not ideal for fast-moving assets.
- Needs Confirmation from Other Indicators: Best used with RSI, MACD, or moving averages.
Conclusion
The Price Momentum Oscillator (PMO) is an effective momentum indicator that helps traders confirm trends, detect reversals, and identify overbought/oversold conditions. By integrating it with other technical indicators, traders can enhance their decision-making process and improve trade accuracy.