Point and Figure Charts: A Unique Approach to Price Action Analysis

Introduction
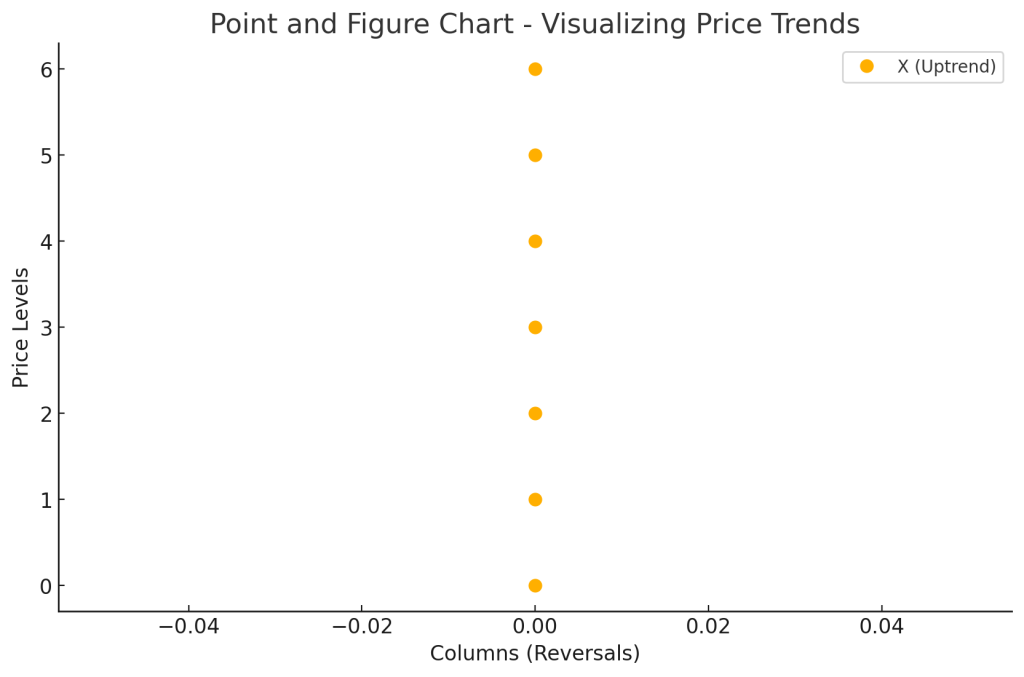
Point and Figure (P&F) Charts are a unique technical analysis tool that filters out market noise by focusing solely on price movements, ignoring time. Unlike traditional candlestick or bar charts, P&F charts use columns of Xs and Os to represent price trends and reversals, making them effective for identifying strong trends and support/resistance levels.
What Are Point and Figure Charts?
Point and Figure charts differ from conventional charts by:
- Ignoring time intervals and only plotting price movements.
- Using X columns to represent rising prices (bullish trends).
- Using O columns to represent falling prices (bearish trends).
- Forming a new column only when price reverses by a predefined amount (reversal box size).
How to Construct a Point and Figure Chart
- Choose a Box Size:
- Defines the minimum price movement required to add an X or O.
- Example: If the box size is $1, then for every $1 move up, an X is added; for every $1 move down, an O is added.
- Set a Reversal Threshold:
- The price must move by at least 3 box sizes to switch from Xs to Os (or vice versa).
- This helps eliminate insignificant price fluctuations.
- Plot Xs and Os:
- An X column continues rising as long as the price increases by at least one box size.
- When price reverses by at least 3 box sizes, a new O column begins.
How to Interpret Point and Figure Charts
- Identifying Trends:
- Uptrend: A series of rising X columns.
- Downtrend: A series of falling O columns.
- Recognizing Support & Resistance:
- Price levels where multiple reversals occur indicate strong support or resistance zones.
- Breakout Signals:
- A breakout above a resistance level in an X column is a bullish signal.
- A breakdown below a support level in an O column is a bearish signal.
Trading Strategies Using Point and Figure Charts
1. Trend Trading with P&F Charts
- Buy when a new X column breaks above the previous high.
- Sell when a new O column breaks below the previous low.
2. P&F Double-Top and Double-Bottom Breakouts
- Double-Top Buy Signal: When an X column breaks above the prior X high.
- Double-Bottom Sell Signal: When an O column falls below the prior O low.
3. Stop-Loss Placement Using P&F Support Levels
- Place stop-loss below the previous O column in an uptrend.
- Place stop-loss above the previous X column in a downtrend.
Example of a Point and Figure Trade
- A stock is in an uptrend, forming a series of X columns.
- A new X column breaks above a previous resistance, signaling a buy entry.
- The trader enters a long position, placing a stop-loss below the prior O column.
Advantages of Using Point and Figure Charts
- Removes Market Noise: Ignores time-based fluctuations and focuses on real trends.
- Clear Trend Identification: Makes it easier to spot breakouts and reversals.
- Effective in All Market Conditions: Works well for stocks, forex, and commodities.
Limitations
- Less Commonly Used: Many traders are unfamiliar with P&F charting.
- Lagging Signals in Rapid Markets: Large price moves can occur before P&F updates.
Conclusion
Point and Figure charts provide a simplified, price-focused approach to technical analysis. They excel at trend identification, support/resistance analysis, and breakout trading. By combining P&F charts with moving averages or RSI, traders can enhance their decision-making and filter out false signals.