Monthly Stock Charts: A Long-Term Perspective on Market Trends
Introduction
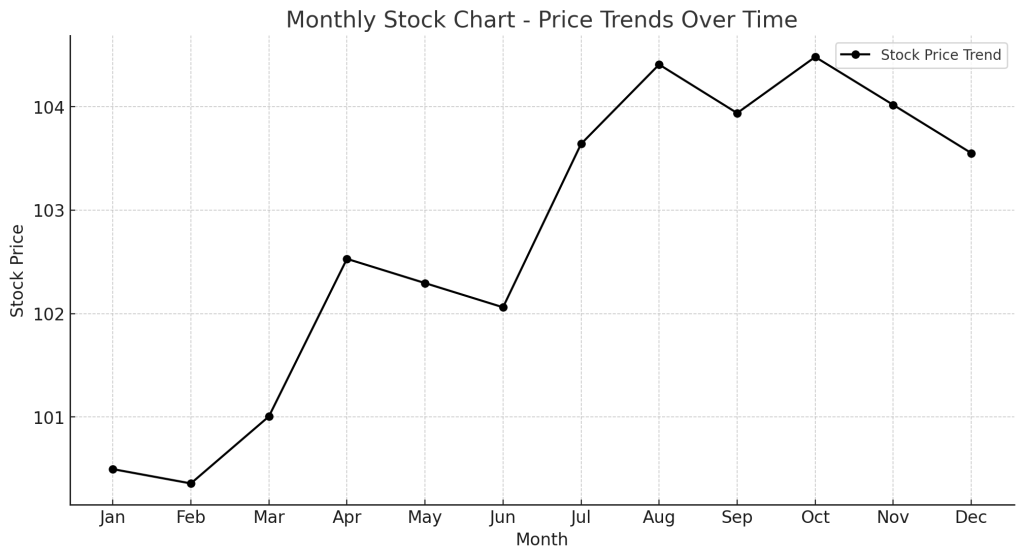
Monthly Stock Charts are essential tools for traders and investors who focus on long-term trends and price movements. These charts provide a broader market perspective by displaying monthly closing prices, making them ideal for trend analysis, portfolio management, and strategic trading decisions.
What is a Monthly Stock Chart?
A Monthly Stock Chart represents the historical price movement of a stock, index, or financial asset over one-month intervals. Unlike daily or intraday charts, monthly charts smooth out short-term fluctuations, making them valuable for identifying major trends.
Key Components of a Monthly Stock Chart
- Price Data: The stock’s monthly open, high, low, and close (OHLC) prices.
- Trendlines: Help identify bullish and bearish trends over time.
- Moving Averages:
- 50-Month Moving Average (Medium-Term): Identifies price direction.
- 200-Month Moving Average (Long-Term): Confirms major market trends.
- Volume Analysis: Measures buying and selling activity within each month.
How to Interpret a Monthly Stock Chart
- Identifying Trends:
- Uptrend: Higher highs and higher lows over multiple months.
- Downtrend: Lower highs and lower lows indicating weakness.
- Sideways Movement: Consolidation phase before a breakout.
- Using Moving Averages:
- If the price is above the 50-month moving average, it signals a bullish trend.
- If the price is below the 200-month moving average, it suggests a bearish trend.
- Breakout and Reversal Patterns:
- Bullish Breakout: Price breaks above a previous resistance level.
- Bearish Reversal: Price falls below a key support level.
Trading Strategies Using Monthly Stock Charts
1. Trend Following Strategy
- Identify stocks in a long-term uptrend using moving averages.
- Buy on pullbacks to the 50-month moving average.
2. Support & Resistance Trading
- Identify long-term support and resistance zones.
- Buy near strong support and sell near major resistance.
3. Volume Confirmation Strategy
- Look for high volume during breakouts or trend reversals.
- High volume confirms institutional interest and trend strength.
Example of a Monthly Stock Chart Trade
- A stock has been trending above the 50-month moving average for the last 12 months.
- The price breaks above a key resistance level, confirming a bullish continuation.
- A trader enters a long position, targeting the next major resistance zone.
Advantages of Using Monthly Stock Charts
- Reduces Market Noise: Filters out short-term fluctuations for a clearer trend.
- Ideal for Long-Term Investors: Helps identify stable stocks for buy-and-hold strategies.
- Works Across Multiple Asset Classes: Useful for stocks, commodities, forex, and indices.
Limitations
- Not Suitable for Short-Term Traders: Monthly charts are not ideal for intraday or swing trading.
- Late Entry in Trend Changes: Signals take longer to develop compared to daily charts.
Conclusion
The Monthly Stock Chart is an invaluable tool for investors and traders focusing on long-term market trends. By using moving averages, trendlines, and volume analysis, traders can make informed decisions with a broader market outlook.