McClellan Oscillator: A Momentum Indicator for Market Breadth Analysis
Introduction
The McClellan Oscillator is a market breadth momentum indicator that helps traders assess the strength of market trends and potential reversals. It is derived from the Advance-Decline Line, which measures the difference between advancing and declining stocks.
What is the McClellan Oscillator?
The McClellan Oscillator is calculated using Exponential Moving Averages (EMAs) of the Advancing-Declining Issues (A-D Line) to track market momentum.
Formula for McClellan Oscillator:
Where:
- Advances = Number of stocks that closed higher than the previous day.
- Declines = Number of stocks that closed lower than the previous day.
- 19-day EMA = Short-term trend strength.
- 39-day EMA = Long-term trend strength.
How to Interpret the McClellan Oscillator
- Positive Values (> 0):
- Indicates bullish momentum.
- The market is experiencing strong breadth and participation.
- Negative Values (< 0):
- Indicates bearish momentum.
- More declining stocks suggest weak market breadth.
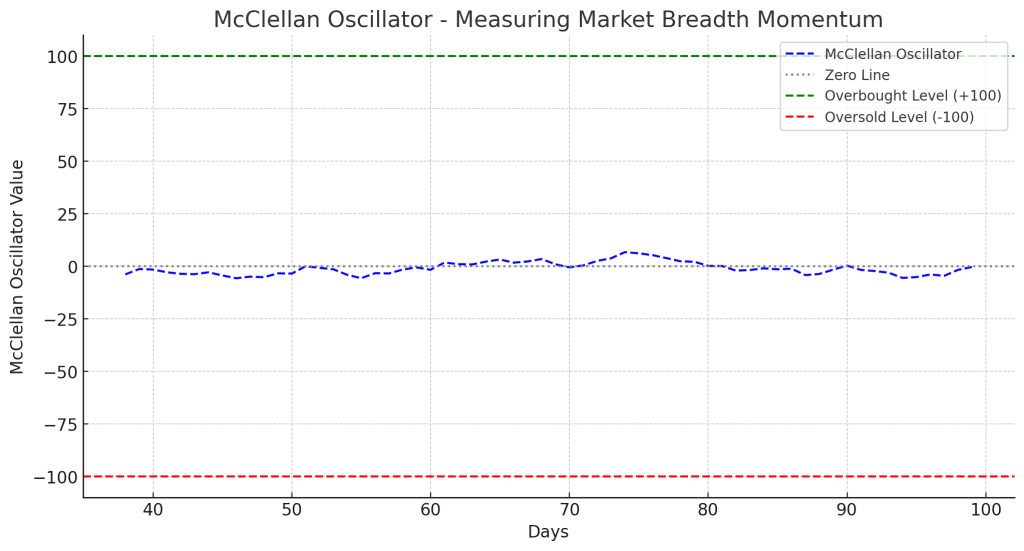
- Overbought & Oversold Levels:
- Above +100: Overbought market → Possible trend reversal downward.
- Below -100: Oversold market → Potential bullish rebound.
- Divergence Signals:
- Bullish Divergence: Market index forms lower lows, but the McClellan Oscillator forms higher lows → Possible reversal upwards.
- Bearish Divergence: Market index forms higher highs, but the McClellan Oscillator forms lower highs → Possible reversal downwards.
Trading Strategies Using McClellan Oscillator
1. Trend Confirmation Strategy
- Bullish signal: Enter long positions when the McClellan Oscillator crosses above zero.
- Bearish signal: Enter short positions when the McClellan Oscillator crosses below zero.
2. Overbought/Oversold Strategy
- If the McClellan Oscillator is above +100, consider taking profits or preparing for a reversal.
- If the McClellan Oscillator is below -100, look for potential buy opportunities.
3. Divergence Trading Strategy
- Buy when the McClellan Oscillator shows bullish divergence (higher lows while price falls).
- Sell when the McClellan Oscillator shows bearish divergence (lower highs while price rises).
Example of a McClellan Oscillator Trade
- The S&P 500 is making new highs, but the McClellan Oscillator is declining.
- This bearish divergence signals weakening momentum.
- A trader exits long positions and prepares for a potential sell-off.
Advantages of Using the McClellan Oscillator
- Confirms Market Momentum: Helps traders assess whether trends are sustainable.
- Filters False Breakouts: Avoids misleading signals by measuring market breadth.
- Effective for Index Trading: Works well with S&P 500, NASDAQ, and NYSE Composite.
Limitations
- Lagging Indicator: Uses moving averages, which can delay signals.
- Works Best in Trending Markets: Less effective in choppy or sideways conditions.
Conclusion
The McClellan Oscillator is a valuable momentum indicator that helps traders analyze market breadth and trend strength. By combining it with support/resistance levels, moving averages, and volume analysis, traders can improve accuracy and identify trend reversals early.