“Elliott Wave Theory: Understanding Market Cycles and Price Predictions”
Elliott Wave Theory, developed by Ralph Nelson Elliott in the 1930s, is a technical analysis tool used to describe price movements in financial markets. The theory identifies recurring fractal wave patterns in stock price movements and consumer behavior, suggesting that market prices move in predictable patterns due to investor psychology.
Basic Structure of Elliott Waves
According to Elliott Wave Theory, market prices move in repetitive cycles, consisting of two main phases:
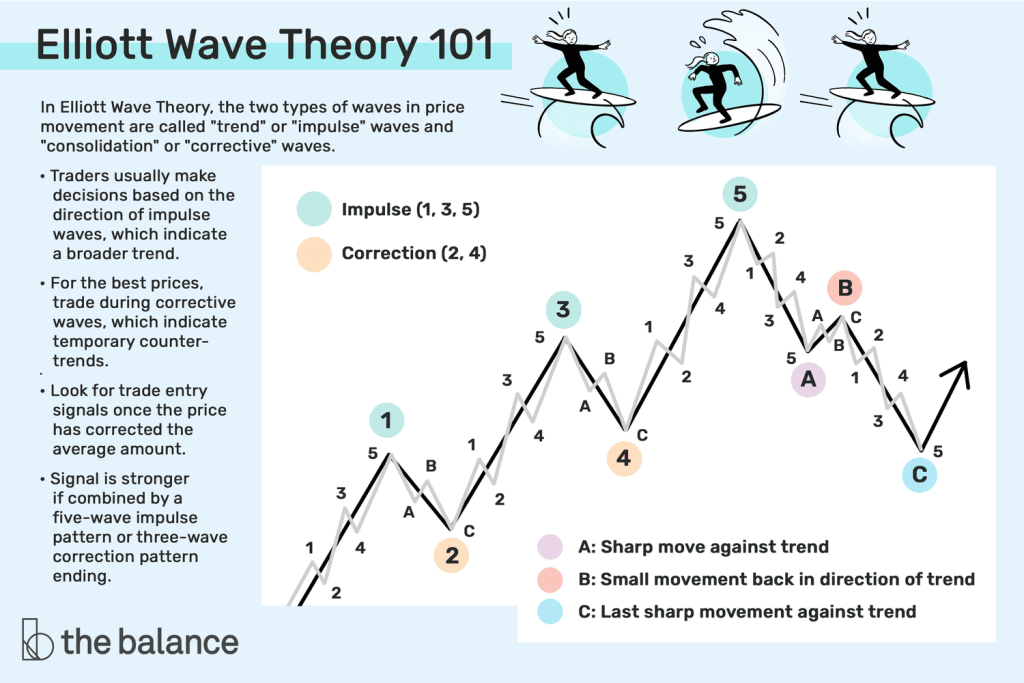
- Impulse Waves: These are five-wave patterns that move in the direction of the prevailing trend. They are labeled as waves 1, 2, 3, 4, and 5.
- Corrective Waves: These are three-wave patterns (labeled as A, B, and C) that move against the prevailing trend, correcting the price movement of the impulse waves.
This eight-wave cycle (five impulse waves followed by three corrective waves) forms the foundation of Elliott Wave Theory.
Application in Trading
Traders use Elliott Wave Theory to identify potential entry and exit points by analyzing the wave patterns. For instance, during an uptrend, a trader might identify an upward-trending impulse wave, go long, and then sell or short the position as the pattern completes five waves and a reversal is imminent.
Challenges and Criticisms
While Elliott Wave Theory provides a framework for understanding market movements, it is not without challenges:
- Subjectivity: Identifying and labeling waves can be subjective, leading to different interpretations among analysts.
- Timing: The theory does not specify the duration of each wave, making it difficult to apply in real-time trading
Despite these challenges, many traders find value in using Elliott Wave Theory alongside other technical analysis tools to enhance their trading strategies.