StockAlerts PRO

  • Home
  • Products
    • SA PRO STOCKS
    • SA PRO FOREX
    • SA PRO FUTURES
    • SA PRO CRYPTO
  • Download 
  • LEARN
    • How to Use SAPRO STOCK
    • How to Use SAPRO FUTURES
    • How to Use SAPRO FOREX
    • How to Use SAPRO CRYPTO
  • Blog
  • Log in
sign up free

Technical Indicators & Analysis

  • Home
  • Technical Indicators & Analysis
  • Page 7
Technical Indicators & Analysis

Bullish Harmonic Patterns: Identifying High-Probability Reversals

May 15, 2025 vijay kumar Comments Off on Bullish Harmonic Patterns: Identifying High-Probability Reversals

Introduction Bullish harmonic patterns are advanced chart formations that help traders predict price reversals with greater precision. These patterns use […]

Technical Indicators & Analysis

Bullish Flag Pattern: A Continuation Signal for Strong Uptrends

May 15, 2025 vijay kumar Comments Off on Bullish Flag Pattern: A Continuation Signal for Strong Uptrends

Bullish Flag Pattern: A Continuation Signal for Strong Uptrends Introduction The Bullish Flag Pattern is a powerful continuation pattern that […]

Technical Indicators & Analysis

Bullish Candlestick Patterns: Identifying Market Uptrends

May 15, 2025 vijay kumar Comments Off on Bullish Candlestick Patterns: Identifying Market Uptrends

Introduction Bullish candlestick patterns help traders recognize trend reversals and buying opportunities in the stock, forex, and crypto markets. These […]

Technical Indicators & Analysis

BOP Indicator: Measuring Buying and Selling Pressure

May 14, 2025 vijay kumar Comments Off on BOP Indicator: Measuring Buying and Selling Pressure

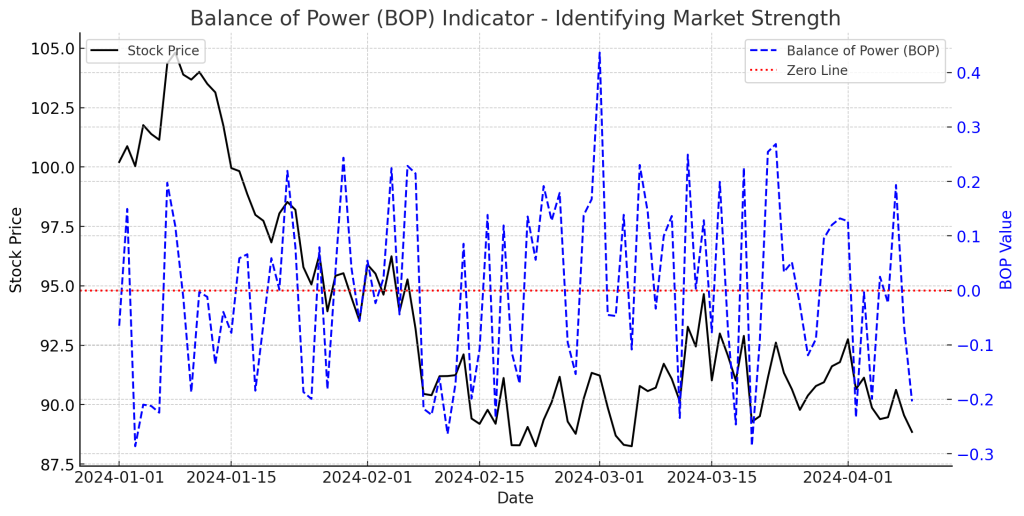
Introduction The Balance of Power (BOP) Indicator is a technical tool that helps traders evaluate the strength of buyers versus […]

Technical Indicators & Analysis

Bollinger Band Squeeze: Identifying Breakout Opportunities

May 14, 2025 vijay kumar Comments Off on Bollinger Band Squeeze: Identifying Breakout Opportunities

Introduction The Bollinger Band Squeeze is a powerful technical analysis strategy that signals low volatility phases before major price movements. […]

Technical Indicators & Analysis

Bearish Reversal Patterns: Identifying Market Downturns

May 14, 2025 vijay kumar Comments Off on Bearish Reversal Patterns: Identifying Market Downturns

Introduction Bearish reversal patterns are technical formations that signal a shift from an uptrend to a downtrend. Traders use these […]

Technical Indicators & Analysis

Bearish Chart Patterns: Spotting Market Downtrends

May 13, 2025 vijay kumar Comments Off on Bearish Chart Patterns: Spotting Market Downtrends

Bearish Chart Patterns: Spotting Market Downtrends Introduction Bearish chart patterns are technical formations that signal trend reversals or downtrend continuations. […]

Technical Indicators & Analysis

Bearish Candlestick Patterns: Identifying Market Downturns

May 13, 2025 vijay kumar Comments Off on Bearish Candlestick Patterns: Identifying Market Downturns

Introduction Bearish candlestick patterns are key indicators of potential trend reversals or downtrends in the stock, forex, and crypto markets. […]

Technical Indicators & Analysis

Balance of Power Indicator: Measuring Buying and Selling Strength

May 13, 2025 vijay kumar Comments Off on Balance of Power Indicator: Measuring Buying and Selling Strength

Introduction The Balance of Power (BOP) Indicator is a technical analysis tool that helps traders measure the buying and selling […]

Technical Indicators & Analysis

Ascending Triangle Pattern: A Bullish Continuation Signal

May 12, 2025 vijay kumar Comments Off on Ascending Triangle Pattern: A Bullish Continuation Signal

Introduction The Ascending Triangle Pattern is a bullish continuation chart pattern that signals a potential breakout to the upside. It […]

Posts pagination

Previous 1 … 6 7 8 … 14 Next

Search

Categories

  • Day Trading 18
  • Free Trading Resources 18
  • Futures & Forex Trading 17
  • Investment Tools 1
  • Reviews 2
  • Stock Alerts & Screeners 41
  • Stock Market Education & Resources 101
  • Stock Signals 14
  • Swing Trading 16
  • Technical Indicators & Analysis 137
  • Trading Platforms & Tools 41
  • Trading Psychology & Strategies 31
  • Uncategorized 44

Recent posts

  • Sensex Graph History: Tracing the Journey of India’s Benchmark Index
  • top laptops for stock trading
    Top Laptops for Stock Trading (2025 Edition)
  • Trade Alert Services: What They Are & How to Choose the Right One

StockAlerts PRO

StockAlerts PRO Strives to make each and every trader successful. Contact us today to get the help you need.

Products
  • SAPRO STOCKS
  • SAPRO FUTURES
  • SAPRO FOREX
  • SAPRO CRYPTO
Resources
  • Contact
  • Documentation
  • Download
Company
  • About us
  • Latest news
  • Resources

© stockalertspro . All Rights Reserved.

  • Terms & Conditions
  • Privacy Policy