Standard Deviation Chart: Measuring Market Volatility Introduction The Standard Deviation Chart is a valuable tool for traders and investors to […]

Standard Deviation Chart: Measuring Market Volatility Introduction The Standard Deviation Chart is a valuable tool for traders and investors to […]

Introduction A Sequence Convergence Calculator helps determine whether a given mathematical sequence converges or diverges. Convergent sequences approach a finite […]

Introduction The Sector Rotation Strategy is an investment approach that involves shifting capital between different market sectors based on the […]

Introduction Sector Rotation is an investment strategy that shifts capital between different market sectors based on the economic cycle. Understanding […]
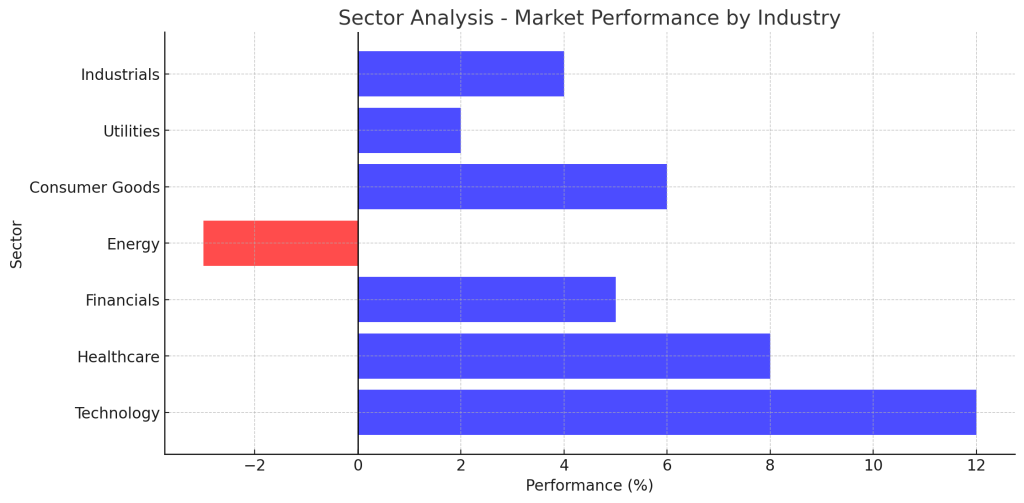
Introduction Sector Analysis is a crucial part of investment research that evaluates the performance of different market sectors. Investors use […]
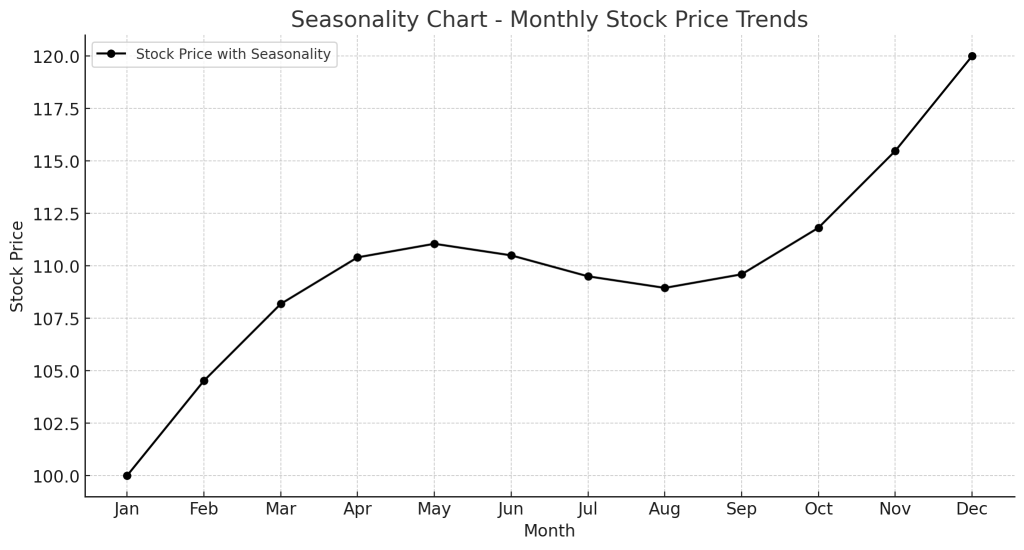
Introduction A Seasonality Chart is a graphical representation of recurring price patterns that occur at specific times of the year. […]
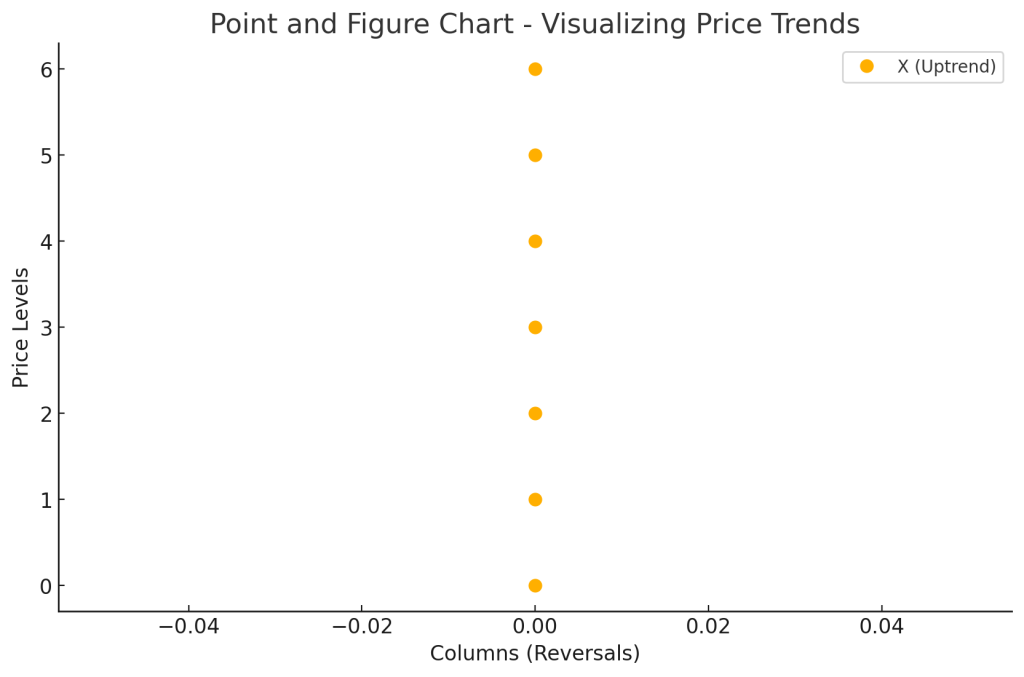
Introduction Point and Figure (P&F) Charts are a unique technical analysis tool that filters out market noise by focusing solely […]
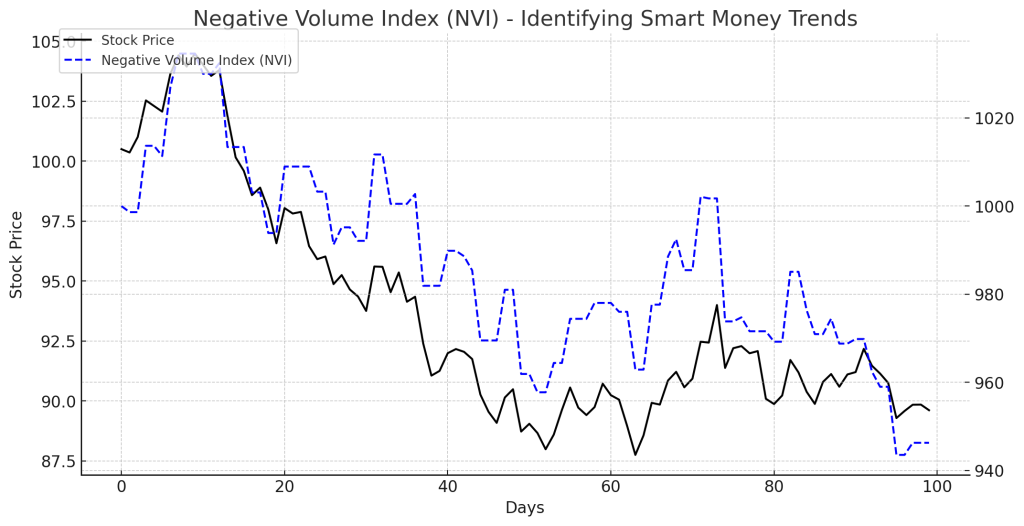
Introduction The Negative Volume Index (NVI) is a technical analysis tool that helps traders track price movements when trading volume […]

Introduction The MFO is a momentum indicator that helps traders assess the strength of buying and selling pressure in a […]
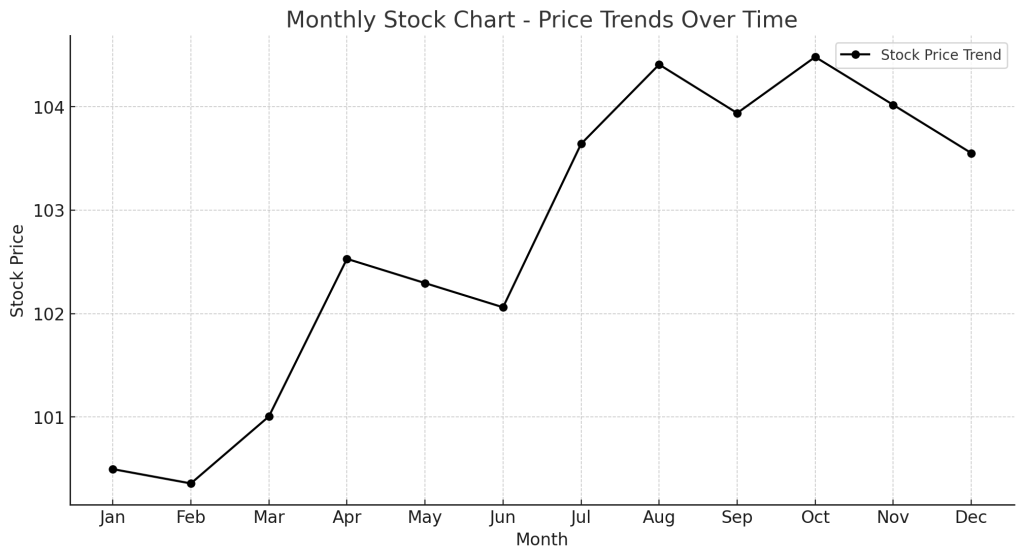
Introduction Monthly Stock Charts are essential tools for traders and investors who focus on long-term trends and price movements. These […]