ATR Indicator: Understanding Average True Range for Volatility Analysis
Introduction
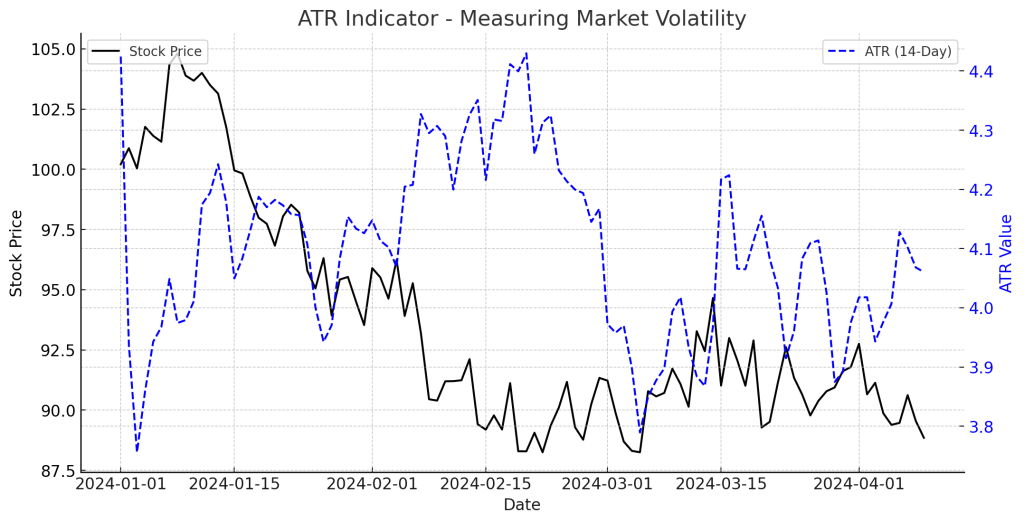
The Average True Range (ATR) Indicator is a key tool in technical analysis used to measure market volatility. Unlike trend indicators, ATR does not predict direction but instead helps traders understand price fluctuations and risk levels.
What is the ATR Indicator?
The ATR Indicator, developed by J. Welles Wilder, calculates the average range of price movement over a given period. It helps traders:
- Identify high and low volatility periods.
- Set appropriate stop-loss levels.
- Adjust position sizing based on market conditions.
How the ATR Indicator Works
ATR is calculated using the True Range (TR): TR=max(High−Low,∣High−PreviousClose∣,∣Low−PreviousClose∣)TR = \max(High – Low, |High – Previous Close|, |Low – Previous Close|)
Then, ATR is derived as the moving average of the True Range over a specific period (e.g., 14 days): ATR=(PreviousATR×(n−1))+TRnATR = \frac{(Previous ATR \times (n – 1)) + TR}{n}
Where n is the number of periods.
How to Use ATR in Trading
1. Measuring Market Volatility
- High ATR: Market is volatile → Expect larger price swings.
- Low ATR: Market is stable → Expect smaller movements.
2. ATR-Based Stop-Loss Strategy
- Set stop-loss levels 1.5x to 2x ATR away from the entry price.
- Ensures stop-loss is adjusted based on volatility, preventing premature exits.
3. Position Sizing with ATR
- Adjust trade size based on ATR volatility to manage risk.
- Example: A high ATR means reducing position size to compensate for larger swings.
Example of an ATR Trade
- A stock has an ATR of $2.00 and is trading at $100.
- A trader enters a long position and places a stop-loss at $96 (2x ATR below entry).
- As volatility increases, ATR rises, prompting a wider stop adjustment.
Advantages of the ATR Indicator
- Enhances Risk Management: Helps set dynamic stop-loss levels.
- Works Across Markets: Useful in stocks, forex, and crypto trading.
- Improves Trade Positioning: Adjusts entry and exit points based on volatility.
Limitations
- Does Not Indicate Trend Direction: Only measures volatility.
- Lagging Indicator: ATR reacts to past price movements.
Conclusion
The ATR Indicator is a powerful volatility tool that enhances risk management, stop-loss placement, and trade sizing. By integrating ATR into a trading strategy, traders can improve their decision-making and adapt to market conditions.