Anchored VWAP: A Modern Tool for Informed Trading
Here is the revised version of the text, addressing the issue of keyphrase density:
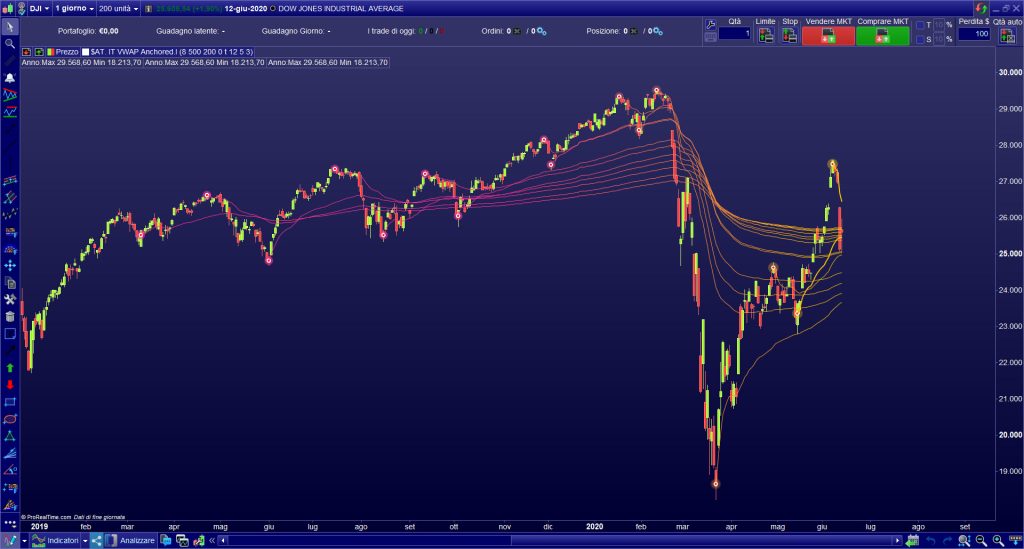
The Anchored Volume Weighted Average Price (VWAP) is a sophisticated technical analysis tool that provides traders and investors with a dynamic view of an asset’s average price over a specified period, weighted by volume. An anchored VWAP differs significantly from the traditional VWAP, which resets daily. This indicator allows users to select a specific starting point (anchor) on the price chart. For instance, they can choose a significant high, low, or even a specific date to begin the calculation. This flexibility offers a more tailored analysis of market trends and potential support or resistance levels.
Understanding the Indicator
This tool calculates the average price of an asset, weighted by trading volume, from a chosen starting point to the current price, using anchored VWAP techniques. By doing so, it reflects the consensus value of all market participants who have traded the asset since that specific anchor. This makes it valuable for identifying areas where the asset’s price may find support or resistance, highlighting levels where significant trading activity has occurred.
Applying It in Trading
Selecting the Anchor Point: The effectiveness of this volume-weighted average price largely depends on the chosen starting point. Traders often select significant price levels, such as major highs or lows, earnings release dates, or other impactful events, to begin the calculation. This allows for a focused analysis of price action relative to these critical points using anchored VWAP.
Identifying Support and Resistance: When the current price is above the calculated line, it suggests that the asset is trading at a premium relative to its volume-weighted average since the anchor point, potentially indicating support levels anchored by VWAP. Conversely, when the price is below this line, it may act as resistance, signaling areas where selling pressure could emerge.
Trend Confirmation: The slope of the plotted line can help confirm the strength and direction of a trend. An upward-sloping line indicates a strong uptrend, while a downward-sloping one suggests a downtrend. Traders can use this information to align their strategies with the prevailing market direction.
Advantages
- Customisation: Traders can tailor the analysis by anchoring the calculation to specific events or timeframes, providing a more relevant view of price action.
- Enhanced Support and Resistance Identification: By considering volume, this tool offers a nuanced perspective on potential support and resistance levels, which can improve entry and exit decisions.
- Versatility: It can be applied across various timeframes and asset classes, making it a versatile tool for different trading strategies.
Implementing in Trading Platforms
Many modern trading platforms, such as TradingView and Thinkorswim, offer this indicator as a built-in tool. To apply it, users typically select it from the drawing tools menu and click on the desired anchor point on the chart. The platform then calculates and displays the line from that point forward, allowing traders to incorporate it into their technical analysis seamlessly.
Conclusion
This customized VWAP is a powerful addition to a trader’s toolkit, offering a dynamic and adaptable approach to analyzing price action. By integrating both price and volume data from a specific starting point, anchored VWAP provides valuable insights into market sentiment and potential support or resistance levels. When combined with other technical indicators and sound trading strategies, this analytical tool can enhance decision-making and contribute to more successful trading outcomes.
Read More about VWAP vs. Anchored VWAP: Understanding the Key Differences