Weekly Stock Charts
Introduction
A Weekly Chart is a type of stock chart that represents price movements over a weekly timeframe. Each candlestick or bar on a weekly chart reflects five trading days, making it an essential tool for long-term traders and investors.
Understanding Weekly Charts
Weekly charts help traders and investors filter out short-term noise and focus on broader market trends. They are commonly used for:
- Swing trading and position trading.
- Long-term trend analysis.
- Identifying key support and resistance levels.
Key Elements of a Weekly Chart
- Candlesticks or Bars: Each candle represents one full trading week.
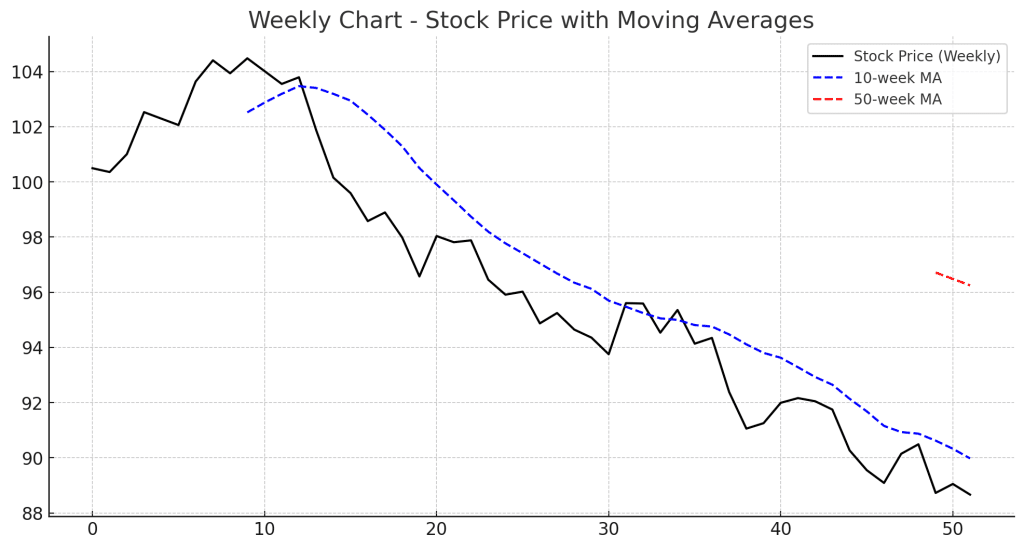
- Moving Averages: The 50-week and 200-week moving averages help identify long-term trends.
- Volume Analysis: Weekly volume spikes indicate strong institutional activity.
- Trendlines: Used to confirm uptrends, downtrends, or sideways movements.
- Indicators: RSI, MACD, and Bollinger Bands help traders gauge momentum and trend strength.
Benefits of Using Weekly Charts
- Eliminates Short-Term Noise: More reliable than daily charts for long-term trends.
- Identifies Major Trend Reversals: Weekly patterns provide stronger confirmation signals.
- Useful for Fundamental Investors: Helps investors avoid short-term price fluctuations.
Trading Strategies Using Weekly Charts
1. Moving Average Strategy
- Bullish Signal: When the price is above the 50-week or 200-week moving average.
- Bearish Signal: When the price is below these levels.
2. Breakout Strategy
- Buy Signal: When the price breaks above a long-term resistance level.
- Sell Signal: When the price breaks below a long-term support level.
3. RSI & MACD Confirmation
- Overbought RSI (>70): Signals a possible correction.
- Oversold RSI (<30): Indicates a potential buying opportunity.
- MACD Crossovers: Confirm bullish or bearish momentum shifts.
Example of Weekly Chart Analysis
- A stock trading above the 50-week moving average signals strong momentum.
- If the price breaks above a weekly resistance level, it confirms bullish strength.
- If volume spikes on a breakout, institutional investors may be entering the stock.
Conclusion
A Weekly Chart is a powerful tool for traders and investors who focus on long-term market trends. By using moving averages, trendlines, and indicators, traders can make more informed decisions and reduce the impact of short-term market fluctuations.