Triple Bottom Reversal: A Powerful Bullish Trend Reversal Pattern
The Triple Bottom Reversal is a bullish reversal pattern that signals the end of a downtrend and the beginning of an uptrend. It is formed when the price hits the same support level three times, indicating strong buying pressure and a potential breakout to the upside.
In this article, we will explore how to identify the Triple Bottom pattern, key trading strategies, and confirmation signals to maximize profits.
1. What is a Triple Bottom Reversal?
A Triple Bottom Reversal is a technical chart pattern that consists of:
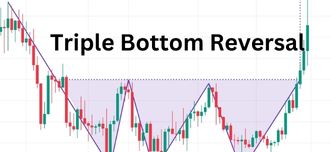
✔ Three distinct lows at the same support level
✔ A breakout above the resistance level after the third bottom
✔ Increased volume on the breakout, confirming the trend reversal
This pattern suggests that sellers have failed three times to push the price lower, leading to a shift in momentum as buyers take control.
2. How to Identify a Triple Bottom Pattern
To confirm a valid Triple Bottom pattern, look for the following characteristics:
📌 Downtrend Preceding the Pattern – The pattern must form after a prolonged downtrend.
📌 Three Equal Lows – The price touches the same support level three times, showing strong buying interest.
📌 Neckline Resistance – A horizontal resistance line is drawn at the highest point between the three bottoms.
📌 Breakout Above the Neckline – A bullish breakout above resistance confirms the pattern.
3. Trading the Triple Bottom Reversal
A. Entry Point
🔹 Enter a buy trade when the price breaks above the neckline resistance with strong volume.
B. Stop-Loss Placement
🔹 Place a stop-loss slightly below the third bottom to minimize risk.
C. Profit Target
🔹 Measure the distance between the neckline and the lowest bottom, then project that distance upwards from the breakout point to set a profit target.
4. Confirmation Indicators for Triple Bottom Reversal
✔ Volume Surge on Breakout – Confirms strong buying pressure.
✔ RSI Moving Above 50 – Indicates bullish momentum.
✔ MACD Bullish Crossover – Signals a shift from bearish to bullish momentum.
5. Example of a Triple Bottom Trade
📌 Stock XYZ Example
- The stock is in a downtrend, forming three equal lows at $50.
- The neckline resistance is at $55.
- A breakout above $55 with high volume confirms the pattern.
- Stop-loss is placed at $48, and the price target is set at $60.
6. Common Mistakes to Avoid
❌ Trading without confirmation – Always wait for a breakout before entering.
❌ Ignoring volume – A breakout without volume may be a false signal.
❌ Setting tight stop-losses – Give the trade enough room to avoid getting stopped out prematurely.
7. Final Thoughts
The Triple Bottom Reversal is a powerful bullish pattern that signals a shift in trend from bearish to bullish. By waiting for a breakout confirmation and using proper risk management, traders can take advantage of this high-probability trading opportunity.