Trading Flags and Pennants: Powerful Continuation Patterns
Trading Flags and Pennants: Powerful Continuation Patterns
Flags and Pennants are two of the most reliable continuation patterns in technical analysis. They often indicate a brief consolidation before the previous trend resumes. Consequently, Trading Flags and Pennants, as powerful continuation patterns, are valuable for traders looking to identify breakout opportunities. This article explores what Flags and Pennants are, how to identify them, and how to trade them effectively. Ultimately, these patterns offer key insights for strategizing.
1. What Are Flags and Pennants?
Both Flags and Pennants appear after a strong price movement. Specifically, they are followed by a brief consolidation phase before the main trend continues. Therefore, they are powerful signals of continuation.
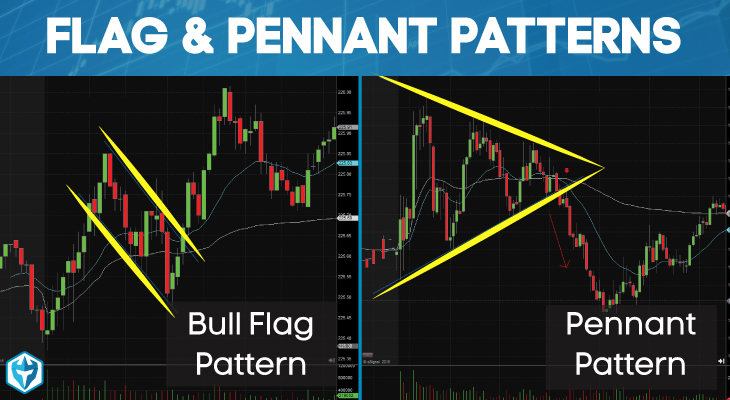
- Flags: These are small, rectangular formations that slope against the prevailing trend.
- Pennants: These are small, symmetrical triangle formations. They resemble a pennant on a flagpole.
In essence, both patterns signal that the current trend will likely continue. As a result, traders should prepare for a breakout in the direction of the prior move.
2. How to Identify Flags and Pennants
A. Flag Pattern
A Flag pattern typically:
- Appears after a sharp price move, which forms the “flagpole.”
- Forms a small, rectangular consolidation that moves against the trend.
- Crucially, a breakout occurs in the direction of the prior trend, confirming the continuation pattern.
- Bullish Flag: This forms after a strong uptrend. Subsequently, a breakout leads to higher prices.
- Bearish Flag: This forms after a strong downtrend. Conversely, a breakout leads to lower prices.
B. Pennant Pattern
A Pennant pattern also:
- Appears after a strong price move.
- Forms a small, symmetrical triangle with converging trendlines.
- Significantly, a breakout occurs in the direction of the prior trend, showcasing the power of these patterns.
- Bullish Pennant: This breaks out upward after an uptrend.
- Bearish Pennant: This breaks out downward after a downtrend.
3. Trading Strategy for Flags and Pennants
A. Entry Strategy
- First, enter the trade when the price breaks out of the flag or pennant.
- Next, confirm the breakout with high trading volume. This confirms the powerful continuation.
- Additionally, use technical indicators like RSI or MACD for further confirmation.
B. Stop-Loss Placement
- For bullish trades, place your stop-loss order below the flag or pennant.
- Conversely, for bearish trades, place your stop-loss order above the flag or pennant. This helps manage the risks inherent in these continuation setups.
C. Profit Target
- Measure the length of the flagpole.
- Then, project this length from the breakout point. This provides a realistic price target for taking profits, aligning your strategies with these powerful patterns.
4. Example of Flag and Pennant Patterns in Trading
Bullish Flag Example
- A stock surges from $50 to $60, creating the “flagpole.”
- Afterward, the price consolidates in a small, downward-sloping channel.
- Finally, a breakout occurs at $61 with high volume.
- Target: $60 (start of consolidation) + Flagpole height ($10) = $70.
Bearish Pennant Example
- A cryptocurrency drops from $30,000 to $28,000, forming the “flagpole.”
- Next, the price consolidates in a small, symmetrical triangle.
- Ultimately, a downward breakout occurs at $27,500, confirming powerful trend continuation.
- Target: $28,000 (start of consolidation) – Flagpole height ($2,000) = $26,000.
5. Key Differences: Flags vs. Pennants
| Feature | Flag | Pennant |
|---|---|---|
| Shape | Rectangular | Small symmetrical triangle |
| Trendlines | Parallel | Converging |
| Slope | Opposite to trend | Neutral |
| Breakout Direction | Follows prior trend | Follows prior trend |
Export to Sheets
In short, Flags are rectangular, while Pennants are triangular. However, both signal trend continuation, making them powerful strategies for traders.
6. Final Thoughts
Flags and Pennants are indeed powerful continuation patterns. They help traders enter trades with strong momentum. By identifying these formations early and confirming breakouts with volume, traders can effectively capitalize on strong price moves.