Stock Chart Analysis: Understanding Price Trends and Patterns
Introduction
Stock Chart Analysis is a crucial skill for traders and investors to interpret price movements and identify potential trading opportunities. By analyzing stock charts, traders can recognize patterns, trends, and key levels that influence stock price movements.
Key Components of Stock Chart Analysis
Stock charts help traders visualize market trends and price action. Here are some essential elements used in the analysis:
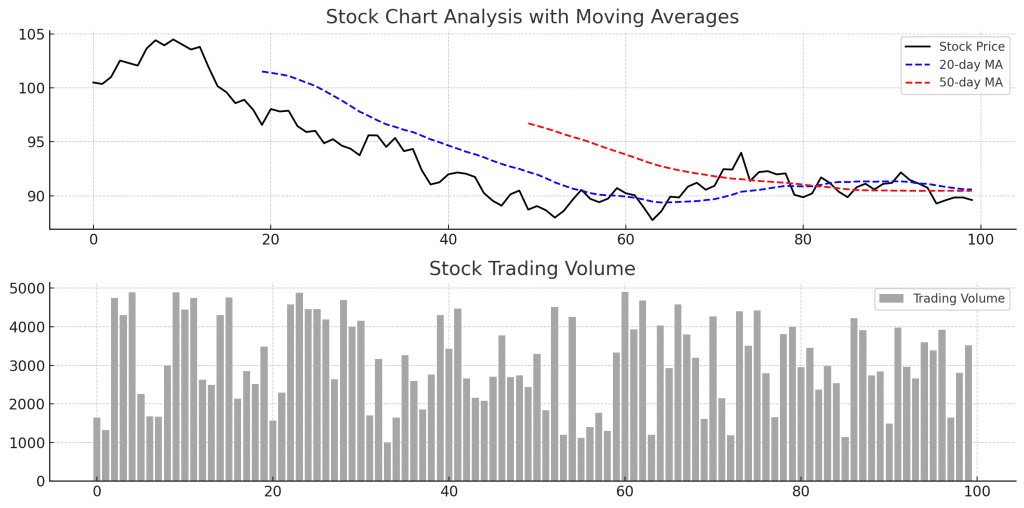
1. Moving Averages
- 20-day Moving Average (MA): Short-term trend indicator.
- 50-day & 200-day MA: Used to identify long-term trends.
- Golden Cross: When the 50-day MA crosses above the 200-day MA, it signals a bullish trend.
2. Support and Resistance Levels
- Support: A price level where demand is strong enough to prevent further declines.
- Resistance: A price level where selling pressure prevents further increases.
3. Trend Lines and Patterns
- Uptrend: When a stock forms higher highs and higher lows.
- Downtrend: When a stock forms lower highs and lower lows.
- Triangle Patterns: Symmetrical, ascending, or descending triangles indicate potential breakouts.
- Head and Shoulders: A reversal pattern indicating a trend change.
4. Volume Analysis
- High Trading Volume: Confirms the strength of a trend or breakout.
- Low Trading Volume: Indicates weaker conviction in price movements.
5. Candlestick Patterns
- Bullish Engulfing: A bullish reversal pattern indicating strong buying pressure.
- Doji: Indicates indecision in the market.
- Hammer & Shooting Star: Signals potential reversals.
Example of Stock Chart Analysis
- A stock price trending above the 50-day moving average signals bullish momentum.
- If the price approaches a resistance level with high volume, it may indicate a breakout.
- A doji candlestick at a support level suggests a potential reversal.
Advantages of Stock Chart Analysis
- Helps Identify Trends: Allows traders to recognize market direction.
- Supports Trading Decisions: Provides insights into optimal entry and exit points.
- Enhances Risk Management: Helps set stop-loss levels and manage risk effectively.
Limitations
- Not Always Predictive: Past price movements do not guarantee future trends.
- False Breakouts: Some patterns may give misleading signals.
Conclusion
Stock Chart Analysis is a vital tool for traders looking to understand price action, trends, and market sentiment. By combining moving averages, support & resistance levels, and candlestick patterns, traders can make informed trading decisions.