RSI Trading Strategy: Using the Relative Strength Index for Profitable Trades
Introduction
The RSI Trading Strategy is a popular approach among traders who use the Relative Strength Index (RSI) to identify market momentum, overbought and oversold conditions, and trend reversals. By applying RSI effectively, traders can improve trade timing and risk management.
How the RSI Trading Strategy Works
RSI is a momentum oscillator that fluctuates between 0 and 100. The key levels for trading signals are:
- Above 70: Overbought – signals a possible sell opportunity.
- Below 30: Oversold – signals a possible buy opportunity.
- Between 50-70: Indicates strong bullish momentum.
- Between 30-50: Suggests bearish momentum.
RSI Trading Strategy Rules
1. Basic RSI Strategy (Overbought/Oversold Reversal)
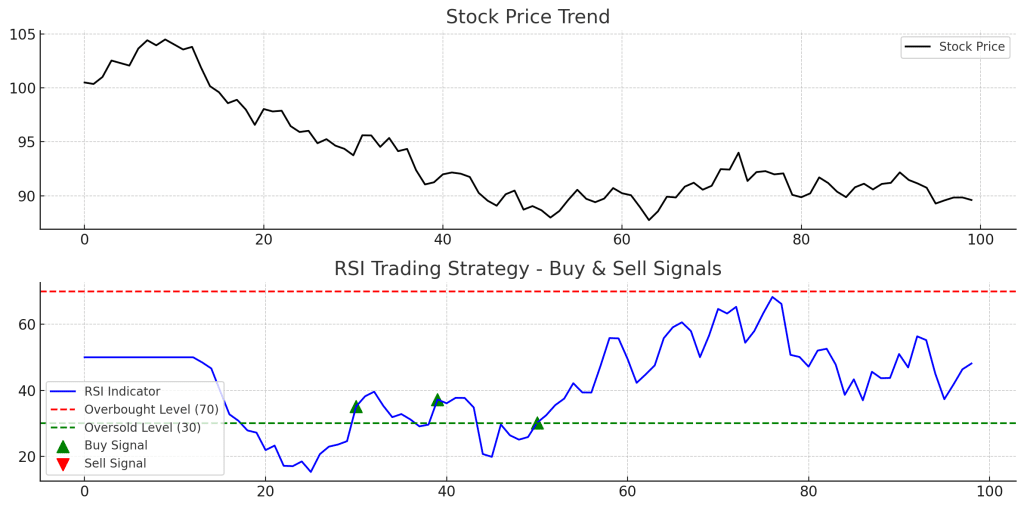
- Buy when RSI crosses above 30 from the oversold region.
- Sell when RSI crosses below 70 from the overbought region.
2. RSI Divergence Strategy
- Bullish Divergence: RSI makes higher lows while price makes lower lows – signals potential uptrend reversal.
- Bearish Divergence: RSI makes lower highs while price makes higher highs – signals potential downtrend reversal.
3. RSI Trend Confirmation Strategy
- Use RSI with Moving Averages or MACD to confirm trade entries.
- If RSI remains above 50 in an uptrend, look for buy opportunities.
- If RSI stays below 50 in a downtrend, favor sell trades.
Example of RSI Trading Strategy in Action
- A stock’s RSI drops below 30 and then moves back above it – Buy signal.
- A stock’s RSI crosses below 70 after being in overbought territory – Sell signal.
- If the stock shows bullish RSI divergence, it suggests an upcoming trend reversal.
Advantages of the RSI Trading Strategy
- Easy to Understand: Clearly defined buy and sell signals.
- Applicable to Any Market: Works well in stocks, forex, and crypto trading.
- Combines Well with Other Indicators: Often paired with MACD, Bollinger Bands, and Moving Averages.
Limitations
- False Signals: RSI can stay overbought or oversold for long periods in strong trends.
- Requires Confirmation Tools: Using RSI with trendlines, volume analysis, or MACD improves accuracy.
Conclusion
The RSI Trading Strategy is a powerful technique for identifying momentum shifts and potential reversals in the market. By combining RSI signals with trend confirmation indicators, traders can refine their strategy and improve trade accuracy.