RSI Formula: How to Calculate the Relative Strength Index
Introduction
The Relative Strength Index (RSI) is a momentum oscillator used in technical analysis to measure the strength of price movements. Understanding the RSI Formula helps traders identify overbought and oversold conditions in a stock or asset, making it a valuable tool for market timing.
RSI Formula
The RSI is calculated using the following formula:
RSI=100−1001+RSRSI = 100 – \frac{100}{1 + RS}
Where RS (Relative Strength) is calculated as:
RS=AverageGainovernperiodsAverageLossovernperiodsRS = \frac{Average Gain over n periods}{Average Loss over n periods}. This forms the basis of the RSI Formula.
- The default period for RSI is 14 days, but traders can adjust it for different timeframes.
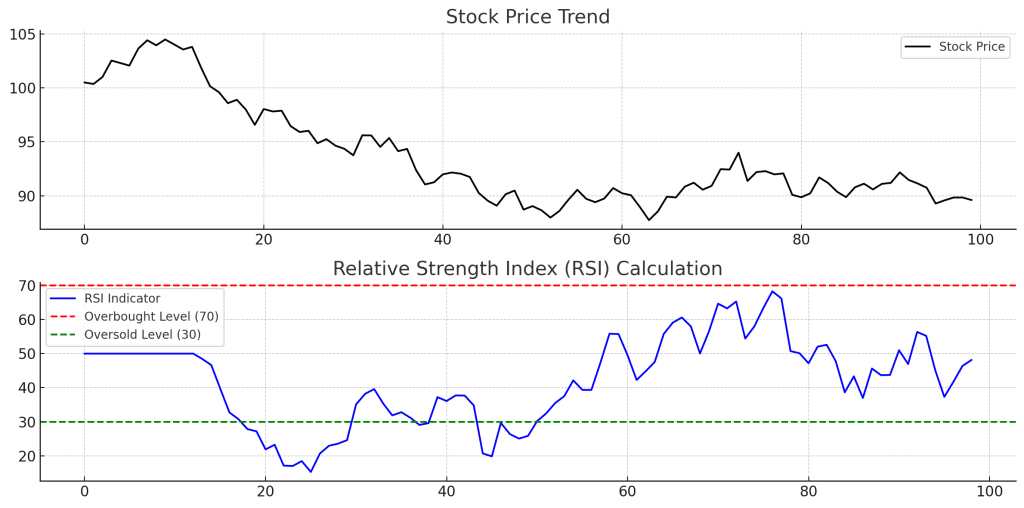
- The values range from 0 to 100, with key levels at 30 (oversold) and 70 (overbought).
Step-by-Step RSI Calculation
- Calculate the daily price changes (positive = gain, negative = loss).
- Compute the average gain and average loss over the chosen period. This step is crucial for the RSI Formula.
- Divide the average gain by the average loss to get RS.
- Apply the RSI formula to compute the final RSI value.
How to Interpret RSI
- RSI above 70: Overbought condition – a potential sell signal.
- RSI below 30: Oversold condition – a potential buy signal according to the RSI Formula.
- RSI between 50-70: Indicates strong bullish momentum.
- RSI between 30-50: Suggests bearish momentum.
Example of RSI in Trading
A trader might:
- Enter a buy trade when RSI moves above 30, confirming upward momentum.
- Enter a sell trade when RSI falls below 70, indicating weakening strength.
- Look for RSI divergences, where price and RSI move in opposite directions, signaling trend reversals. Traders often rely on the RSI Formula for such analyses.
Advantages of RSI
- Easy to Use: Simple to calculate and interpret thanks to the clear RSI Formula.
- Works Across Different Markets: Useful in stocks, forex, and cryptocurrency trading.
- Combines Well with Other Indicators: Often paired with MACD, Moving Averages, and Bollinger Bands.
Limitations
- False Signals: RSI can remain overbought or oversold for long periods in strong trends.
- Should Be Used with Confirmation Tools: Combining RSI with volume analysis or trend indicators improves accuracy.
Conclusion
The RSI Formula is a powerful tool for traders looking to measure market momentum and identify potential entry and exit points. When used alongside trend indicators and support/resistance levels, RSI enhances trading strategies and improves decision-making.