Rising Wedge Stock Pattern: A Bearish Reversal Formation
Introduction
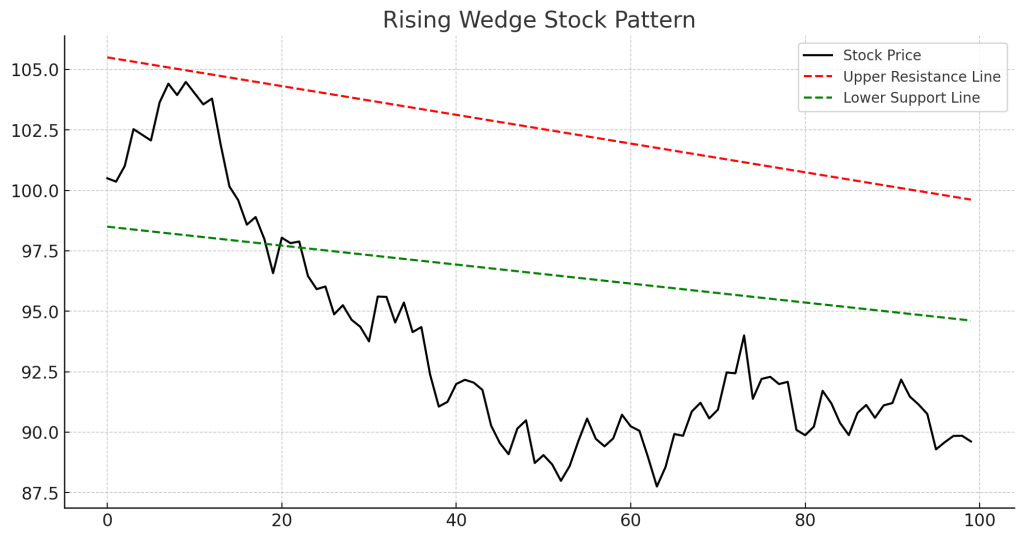
The Rising Wedge Stock Pattern is a bearish chart pattern that signals a potential downtrend reversal. It occurs when the stock price moves higher but within a narrowing range, showing weakening momentum.
Understanding the Rising Wedge Stock Pattern
A Rising Wedge forms when:
- The stock price makes higher highs and higher lows, but the range contracts.
- The resistance and support trendlines converge, forming an upward-sloping wedge.
- Decreasing volume indicates weakening buying pressure.
- A breakdown below the lower support trendline confirms the bearish pattern.
How to Identify a Rising Wedge Pattern
- Upward Sloping Trendlines: Connect the higher highs and higher lows.
- Narrowing Price Range: The price moves in a contracting wedge.
- Bearish Breakout: A price drop below the lower support line confirms the pattern.
- Divergence on RSI or MACD: Weakening momentum often accompanies the pattern.
Trading Strategies Using the Rising Wedge
A trader might:
- Enter a short position after a breakdown below the support line.
- Set a stop-loss just above the latest high to manage risk.
- Target a decline equal to the height of the wedge from the breakdown point.
Example of Rising Wedge Stock Trading
- Suppose a stock trends upward but starts forming a contracting range.
- If the price breaks below the support level with increased volume, it signals a bearish move.
- A trader enters a short position, expecting a downtrend.
Advantages of the Rising Wedge Pattern
- Early Warning of a Reversal: Helps traders exit long positions before a drop.
- Well-Defined Entry and Exit Points: Stop-loss and target levels are clear.
- Works in Stocks, Forex, and Crypto: A reliable pattern across different markets.
Limitations
- False Breakouts: Sometimes, price may break upward instead.
- Needs Confirmation: RSI, MACD, or volume analysis improves accuracy.
Conclusion
The Rising Wedge Stock Pattern is a key bearish reversal indicator that warns of an impending downtrend. When combined with trend confirmation tools and volume analysis, traders can improve their success rate in identifying profitable trade setups.