Negative Volume Index (NVI): Identifying Smart Money Trends
Introduction
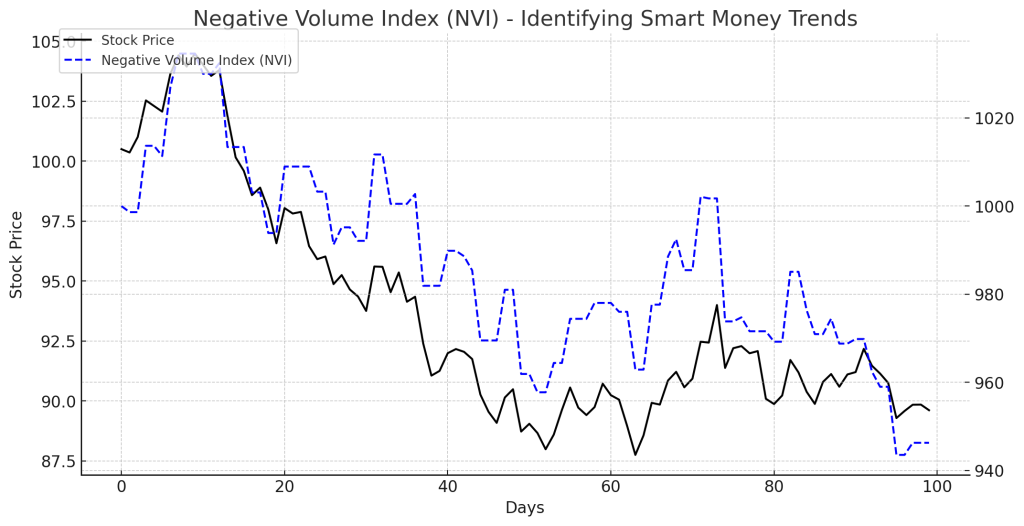
The Negative Volume Index (NVI) is a technical analysis tool that helps traders track price movements when trading volume decreases. It is based on the idea that smart money (institutional investors) operates in lower-volume conditions, while retail traders dominate high-volume days.
What is the NVI ?
The NVI focuses only on days when volume declines, assuming that significant price changes on low-volume days are influenced by institutional investors, which aligns with the essence of the NVI
Formula for Negative Volume Index (NVI):
If today’s volume is lower than the previous day’s volume:
Otherwise:

How to Interpret the NVI
- Uptrend Confirmation:
- If NVI rises alongside price, institutional money is supporting the trend, confirming the principles of the Negative Volume Index.
- Suggests a bullish confirmation.
- Bearish Warning:
- If price rises but NVI remains flat or declines, the uptrend may lack smart money support.
- Could signal a potential market reversal.
- Divergence Signals:
- Bullish Divergence: Price is declining, but NVI is rising – suggests accumulation by institutions.
- Bearish Divergence: Price is rising, but NVI is flat or falling – suggests distribution by institutions.
Trading Strategies Using NVI
1. Trend Confirmation Strategy
- If NVI is increasing, stay in long positions.
- If NVI declines while price rises, consider reducing exposure.
2. Divergence Trading
- If price falls but NVI remains stable or rises, institutions may be accumulating shares as suggested by the Negative Volume Index.
- If price rises but NVI is flat or declining, institutions may be exiting positions.
3. Combining NVI with Moving Averages
- Use the 255-day Moving Average of NVI:
- If NVI is above its 255-day MA, bullish confirmation.
- If NVI is below its 255-day MA, bearish confirmation.
Example of an NVI Trade
- A stock’s price has been rising, but NVI remains flat.
- This suggests the rally is driven by retail traders rather than institutions as tracked by the Negative Volume Index.
- The trader prepares for a potential price correction or reversal.
Advantages of Using NVI
- Detects Institutional Money Flow: Helps track smart money activity.
- Enhances Trend Confirmation: Confirms whether trends are strong or weak as the Negative Volume Index helps distinguish.
- Filters Noise from Volume Spikes: Ignores high-volume retail-driven price swings.
Limitations
- Not Useful in High-Volume Markets: NVI does not react to strong volume days.
- Best Used with Other Indicators: Works best alongside Moving Averages, OBV, or RSI to complement the Negative Volume Index.
Conclusion
The Negative Volume Index (NVI) is a powerful tool for identifying institutional money flow and trend strength. By analyzing NVI alongside price action and moving averages, traders can improve decision-making and risk management.