Money Flow Index (MFI): Measuring Market Strength and Volume Pressure
Introduction
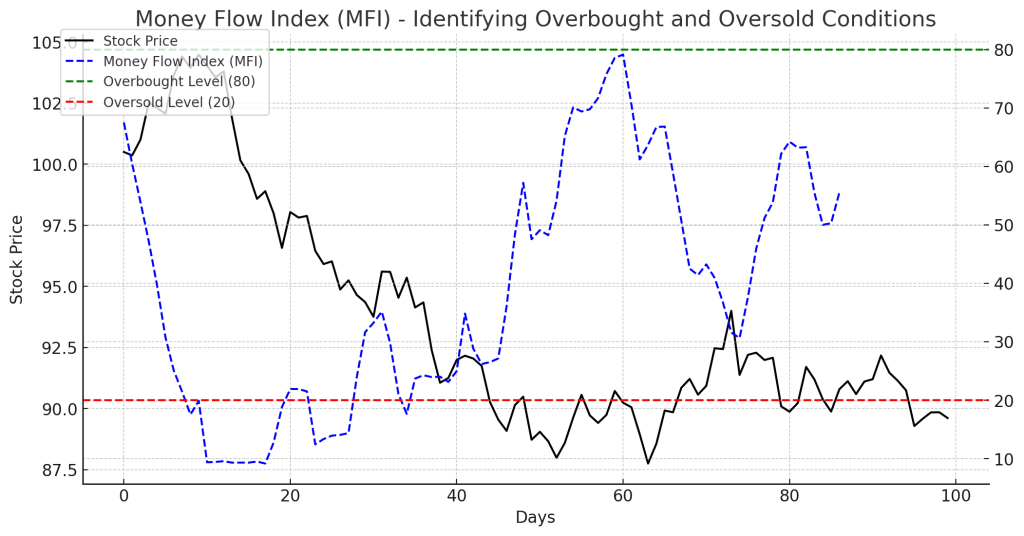
The Money Flow Index (MFI) is a momentum oscillator that uses both price and volume to measure buying and selling pressure. Often referred to as the volume-weighted RSI, MFI helps traders identify overbought and oversold market conditions.
What is the MFI?
MFI is calculated using typical price and trading volume to determine the flow of money into and out of a stock. Understanding MFI can enhance your trading effectiveness.
Formula for MFI Calculation:

- Typical Price (TP):
- Raw Money Flow (RMF):
- Money Flow Ratio (MFR):
- Money Flow Index (MFI):
How to Interpret the MFI
- Overbought and Oversold Conditions:
- Above 80: Overbought (potential sell signal).
- Below 20: Oversold (potential buy signal).
- Money Flow Divergence:
- Bullish Divergence: MFI rises while price declines – potential upward reversal.
- Bearish Divergence: MFI declines while price increases – potential downward reversal.
- MFI Trend Confirmation:
- Rising MFI confirms strong buying momentum.
- Falling MFI suggests increasing selling pressure. Proper usage of Money Flow Index can provide these insights.
Trading Strategies Using MFI
1. Overbought/Oversold Strategy
- Buy when MFI crosses above 20 from oversold territory. MFI shows an opportunity.
- Sell when MFI crosses below 80 from overbought territory.
2. Divergence Trading
- If price forms a lower low, but MFI forms a higher low, it signals a potential reversal upward.
- If price makes a higher high, but MFI forms a lower high, it indicates a possible price decline, using MFI trends.
3. Trend Confirmation with MFI
- When MFI is above 50, buying pressure dominates.
- When MFI is below 50, selling pressure dominates.
Example of an MFI Trade
- A stock’s MFI drops below 20, signaling an oversold condition.
- The stock’s price stabilizes, and MFI starts rising above 20, indicating a buying opportunity.
- A trader enters a long position, capturing an upward price movement. Here, Money Flow Index provides a valuable signal.
Advantages of Using MFI
- Combines Price and Volume: Unlike RSI, MFI incorporates volume to provide stronger signals, showcasing the Money Flow Index effectiveness.
- Effective in Range-Bound Markets: Works well when prices move within a trading range.
- Identifies Institutional Buying and Selling: Large volume shifts signal big market moves.
Limitations
- False Signals in Strong Trends: MFI can stay overbought/oversold for extended periods.
- Best Used with Other Indicators: Combining with MACD, RSI, or Moving Averages improves accuracy. Money Flow Index should be used alongside other tools.
Conclusion
The Money Flow Index (MFI) is an essential tool for identifying overbought/oversold conditions, confirming trends, and detecting divergences. By incorporating MFI into trading strategies, traders can improve their trade execution and risk management.