Accumulation/Distribution (A/D) Indicator: Analyzing Market Strength Through Price and Volume
The Accumulation/Distribution (A/D) Indicator is a volume-based technical analysis tool developed to assess the cumulative flow of money into and out of a security. By analyzing both price movements and trading volume, the A/D Indicator helps traders identify underlying buying (accumulation) or selling (distribution) pressures that may not be immediately evident from price action alone.
Understanding the Accumulation/Distribution Indicator
The A/D Indicator operates on the premise that the relationship between a stock’s closing price and its trading range, when combined with volume, can signal the strength of buying or selling pressure. The indicator calculates a money flow multiplier, which determines the position of the closing price relative to the high-low range for the period. This multiplier is then multiplied by the period’s volume to arrive at the Money Flow Volume. The Accumulation/Distribution Line is a running total of these Money Flow Volume values.
Calculation Steps:
- Money Flow Multiplier (MFM): MFM=(Close−Low)−(High−Close)High−Low\text{MFM} = \frac{( \text{Close} – \text{Low} ) – ( \text{High} – \text{Close} )}{ \text{High} – \text{Low} }MFM=High−Low(Close−Low)−(High−Close) This formula positions the closing price within the day’s range, yielding values between -1 and +1.
- Money Flow Volume (MFV): MFV=MFM×Volume\text{MFV} = \text{MFM} \times \text{Volume}MFV=MFM×Volume
- Accumulation/Distribution Line (A/D Line): A/D Line=Previous A/D Line+MFV\text{A/D Line} = \text{Previous A/D Line} + \text{MFV}A/D Line=Previous A/D Line+MFV
Interpreting the A/D Indicator:
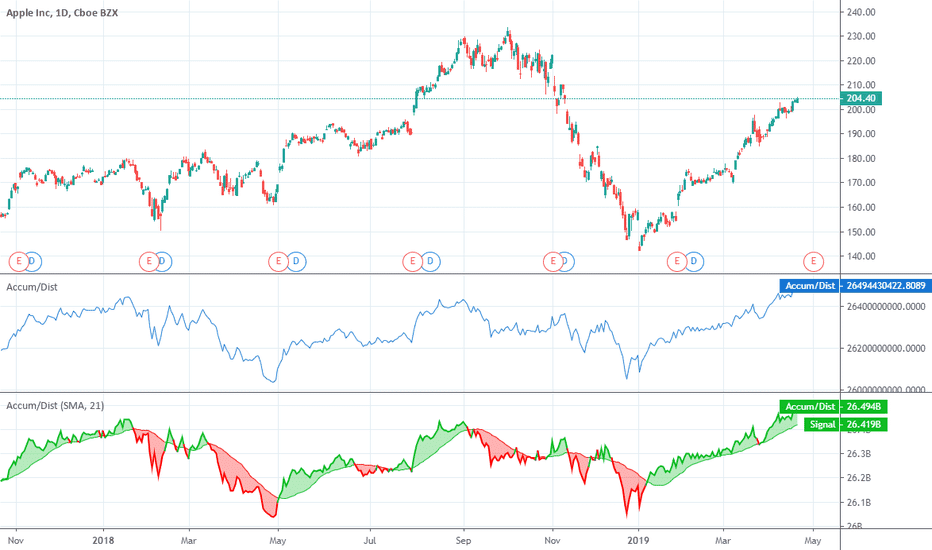
- Upward-Sloping A/D Line: Indicates accumulation, suggesting that buying pressure is prevailing as the stock often closes near its high with significant volume.
- Downward-Sloping A/D Line: Signals distribution, implying that selling pressure dominates as the stock frequently closes near its low with substantial volume.
- Divergence: When the A/D Line moves in the opposite direction of the stock’s price, it may indicate a potential trend reversal. For instance, if the price is rising but the A/D Line is falling, it could suggest weakening buying pressure and an impending downturn.
Practical Application:
Traders utilize the A/D Indicator to confirm trends and anticipate potential reversals. For example, if a stock’s price is in an uptrend accompanied by an upward-sloping A/D Line, the trend is considered strong. Conversely, if the price is rising while the A/D Line is falling, it may warn of a weakening trend and possible reversal.
Limitations:
While the A/D Indicator provides valuable insights, it has limitations. It does not account for price gaps between trading sessions, which can lead to inaccuracies. Additionally, in markets with low liquidity or erratic volume spikes, the indicator’s reliability may diminish.
Conclusion:
The Accumulation/Distribution Indicator is a potent tool for assessing the underlying buying and selling pressures in a security. By integrating price and volume data, it offers traders a deeper understanding of market dynamics, aiding in more informed trading decisions. However, like all indicators, it should be used in conjunction with other analysis tools and within the broader context of the market.