The double top pattern is a bearish reversal chart pattern that signals a potential shift from an uptrend to a […]

The double top pattern is a bearish reversal chart pattern that signals a potential shift from an uptrend to a […]

The descending wedge pattern, also known as the falling wedge, is a technical analysis chart pattern that typically indicates a […]

Introduction In the realm of technical analysis, chart patterns serve as essential tools for traders and investors to predict potential […]

The Alligator Indicator, developed by renowned trader and author Bill Williams, is a technical analysis tool designed to identify market […]
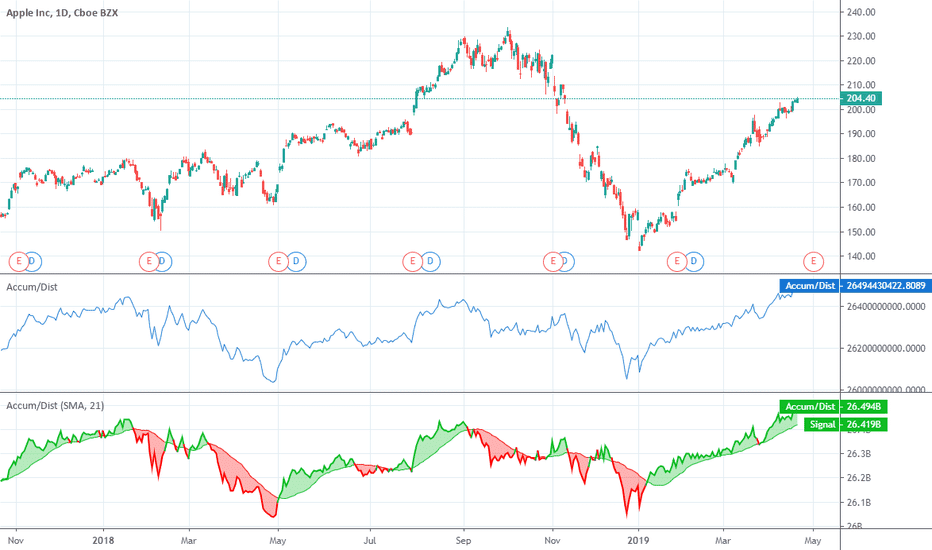
The Accumulation/Distribution (A/D) Indicator is a volume-based technical analysis tool developed to assess the cumulative flow of money into and […]
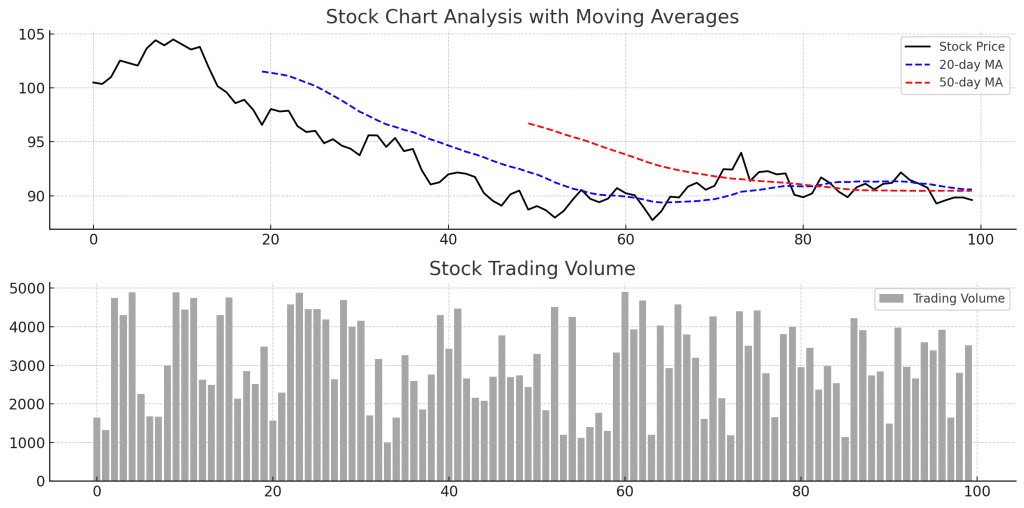
Introduction Stock Chart Analysis is a crucial skill for traders and investors to interpret price movements and identify potential trading […]

Introduction The SAR Indicator (Stop and Reverse), also known as the Parabolic SAR, is a technical analysis tool developed by […]
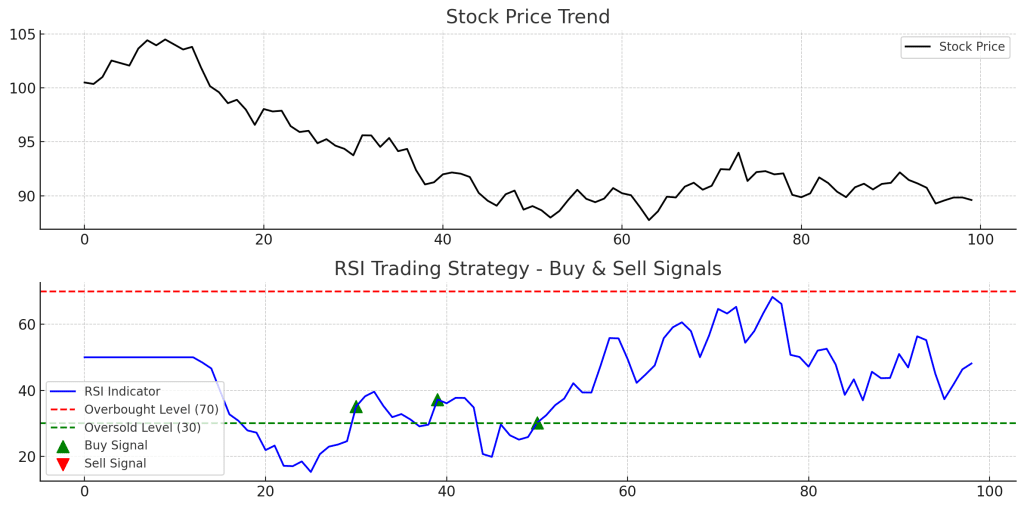
Introduction The RSI Trading Strategy is a popular approach among traders who use the Relative Strength Index (RSI) to identify […]
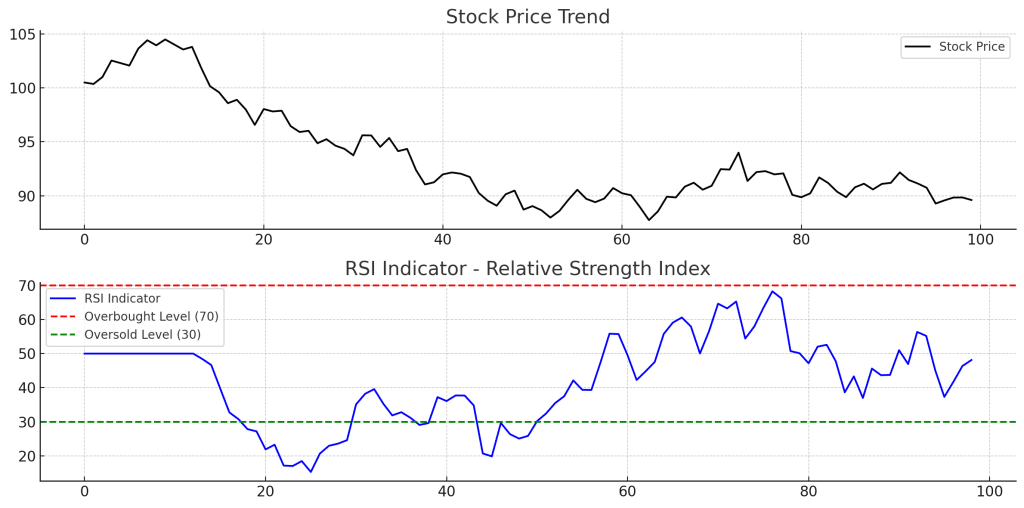
Introduction The RSI Indicator (Relative Strength Index) is a momentum oscillator used in technical analysis to measure the speed and […]

Introduction The Relative Strength Index (RSI) is a momentum oscillator used in technical analysis to measure the strength of price […]