Stock analysis no longer requires expensive tools. Today, several platforms offer free software for stock analysis, packed with powerful features […]
Stock analysis no longer requires expensive tools. Today, several platforms offer free software for stock analysis, packed with powerful features […]
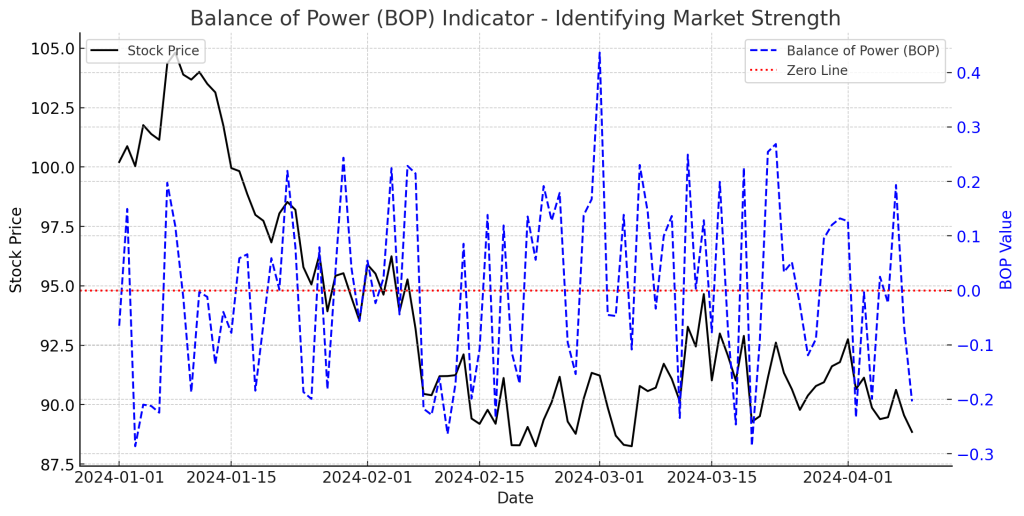
Introduction The Balance of Power (BOP) Indicator is a technical tool that helps traders evaluate the strength of buyers versus […]

Introduction The Bollinger Band Squeeze is a powerful technical analysis strategy that signals low volatility phases before major price movements. […]

Introduction Bearish reversal patterns are technical formations that signal a shift from an uptrend to a downtrend. Traders use these […]

Bearish Chart Patterns: Spotting Market Downtrends Introduction Bearish chart patterns are technical formations that signal trend reversals or downtrend continuations. […]

Introduction Bearish candlestick patterns are key indicators of potential trend reversals or downtrends in the stock, forex, and crypto markets. […]

Introduction The Balance of Power (BOP) Indicator is a technical analysis tool that helps traders measure the buying and selling […]

Introduction The Ascending Triangle Pattern is a bullish continuation chart pattern that signals a potential breakout to the upside. It […]
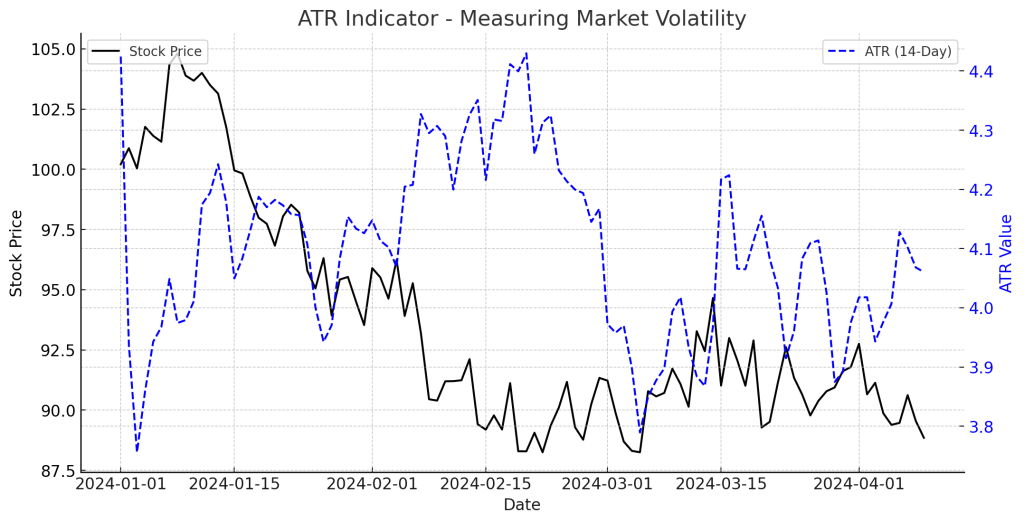
Introduction The Average True Range (ATR) Indicator is a key tool in technical analysis used to measure market volatility. Unlike […]

ThinkorSwim (TOS) is a professional-grade trading platform developed by TD Ameritrade (now part of Charles Schwab). It offers advanced charting, […]