The Triple Exponential Moving Average (TEMA) is a trend-following indicator that smoothens price data while minimizing lag. Developed by Patrick […]
The Triple Exponential Moving Average (TEMA) is a trend-following indicator that smoothens price data while minimizing lag. Developed by Patrick […]
Bullish chart patterns help traders identify potential buying opportunities by signaling a trend reversal or continuation. These patterns appear in […]
Navigating stock markets for successful trading demands a keen understanding of trends, momentum, and prevailing market conditions. Technical indicators empower […]
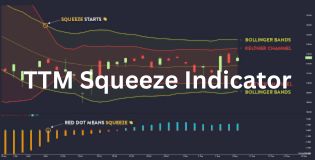
The TTM Squeeze Indicator is a momentum and volatility-based trading tool that helps traders identify potential breakout opportunities. Developed by […]
The True Strength Index (TSI) is a momentum-based indicator that helps traders identify trend direction and potential reversals. Developed by […]

Technical indicators are mathematical calculations. They use a security’s price, volume, or open interest. Ultimately, these indicators help traders identify […]
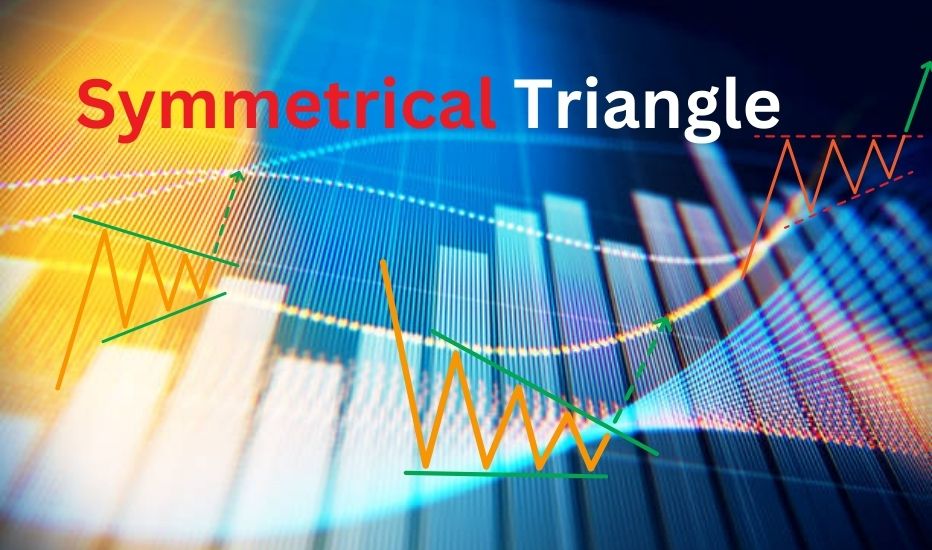
The Symmetrical Triangle is a common chart pattern that signals a potential breakout in either direction. It forms when price […]

Introduction The Kaufman’s Adaptive Moving Average (KAMA) is a unique moving average designed to adjust dynamically to market conditions. Unlike […]

Introduction The Inverse Head and Shoulders pattern is one of the most reliable bullish reversal patterns in technical analysis. It […]

Introduction The Institutional Money Flow Indicator (IMFI) helps traders track the movements of big money players, such as hedge funds, […]