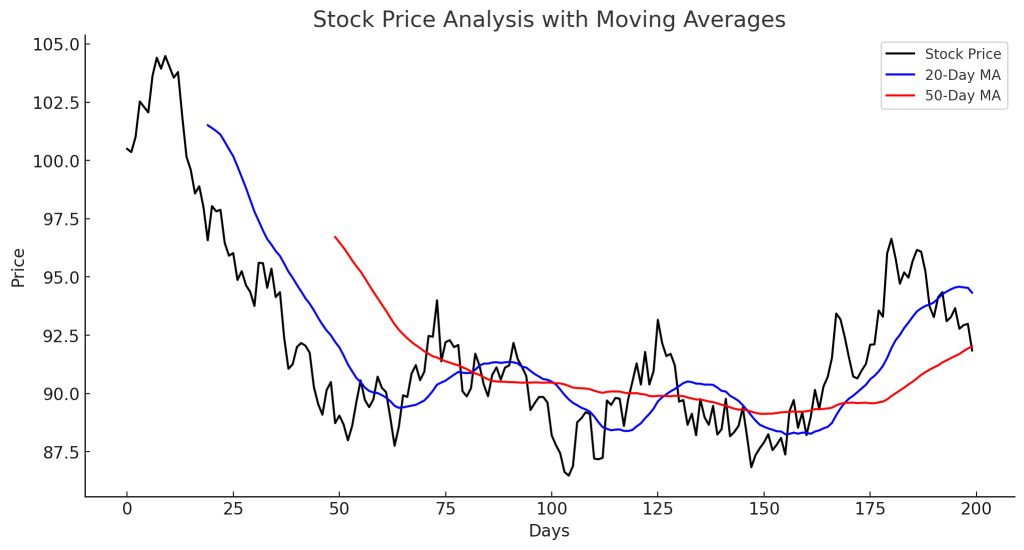
Introduction Stock Chart Analysis is a crucial skill for traders and investors to interpret price movements and identify potential trading […]
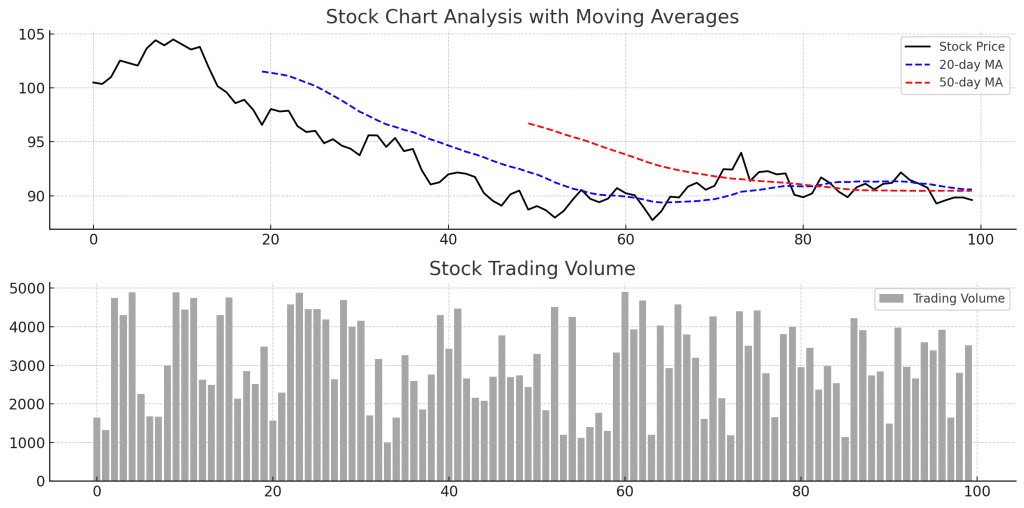
Introduction Stock Chart Analysis is a crucial skill for traders and investors to interpret price movements and identify potential trading […]

Introduction The SAR Indicator (Stop and Reverse), also known as the Parabolic SAR, is a technical analysis tool developed by […]
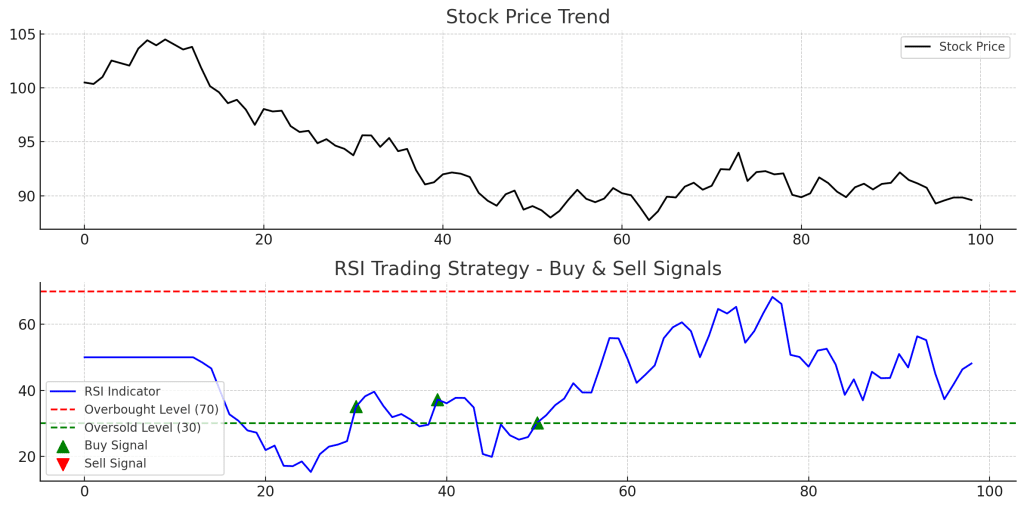
Introduction The RSI Trading Strategy is a popular approach among traders who use the Relative Strength Index (RSI) to identify […]
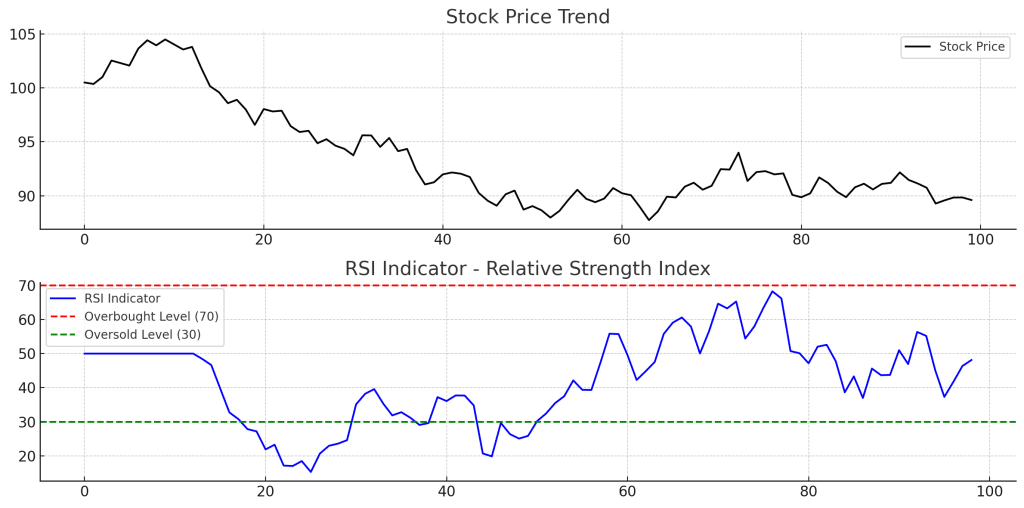
Introduction The RSI Indicator (Relative Strength Index) is a momentum oscillator used in technical analysis to measure the speed and […]

Introduction The Relative Strength Index (RSI) is a momentum oscillator used in technical analysis to measure the strength of price […]
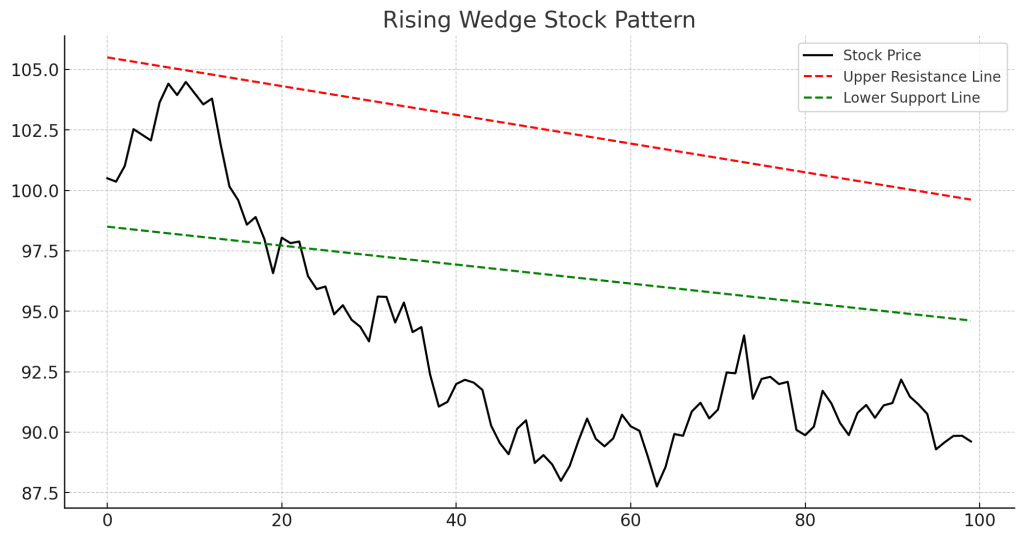
Introduction The Rising Wedge Stock Pattern is a bearish chart pattern that signals a potential downtrend reversal. It occurs when […]
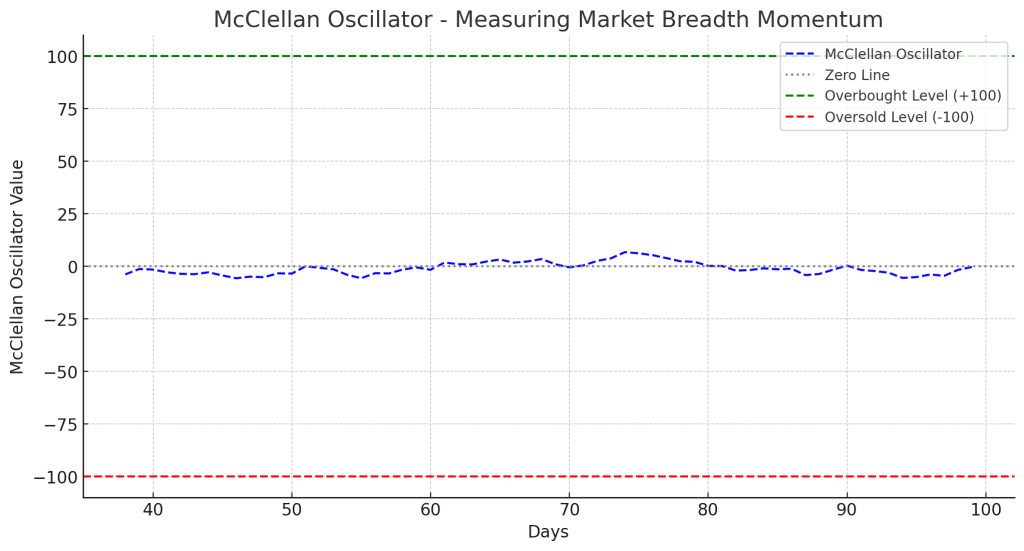
Introduction The McClellan Oscillator is a market breadth momentum indicator that helps traders assess the strength of market trends and […]
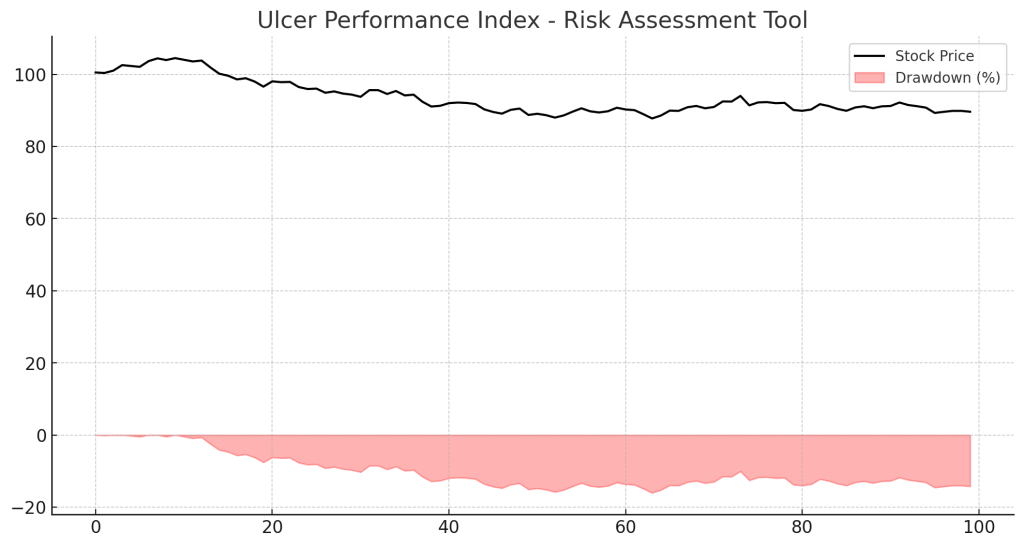
Introduction The Ulcer Performance Index (UPI) is a financial metric that evaluates an investment’s risk-adjusted return by focusing on drawdowns […]
Introduction Stock analysis is a crucial process for investors and traders to evaluate a company’s financial health, performance, and future […]
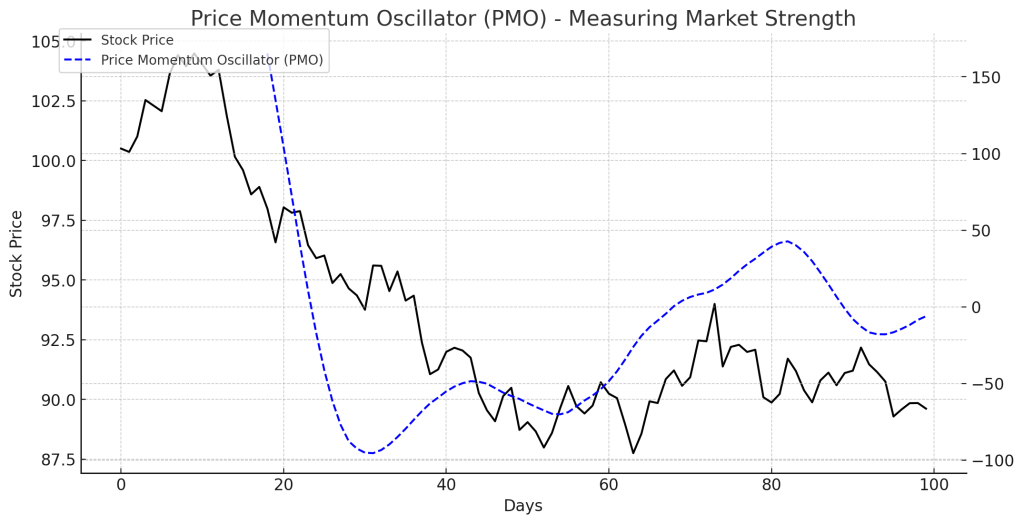
Introduction The Price Momentum Oscillator (PMO) is a powerful technical indicator that helps traders measure market momentum, trend strength, and […]