Introduction A Weekly Chart is a type of stock chart that represents price movements over a weekly timeframe. Each candlestick […]
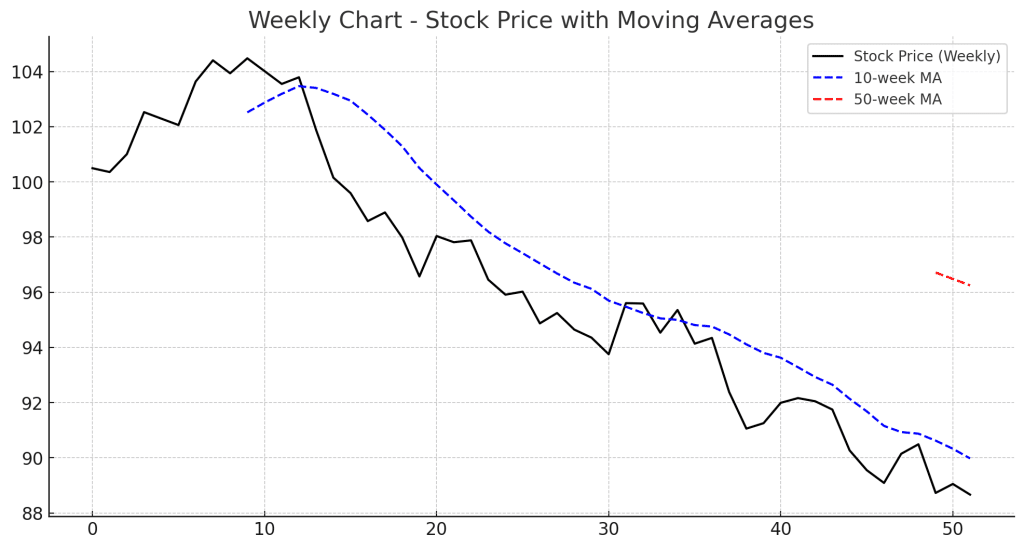
Introduction A Weekly Chart is a type of stock chart that represents price movements over a weekly timeframe. Each candlestick […]
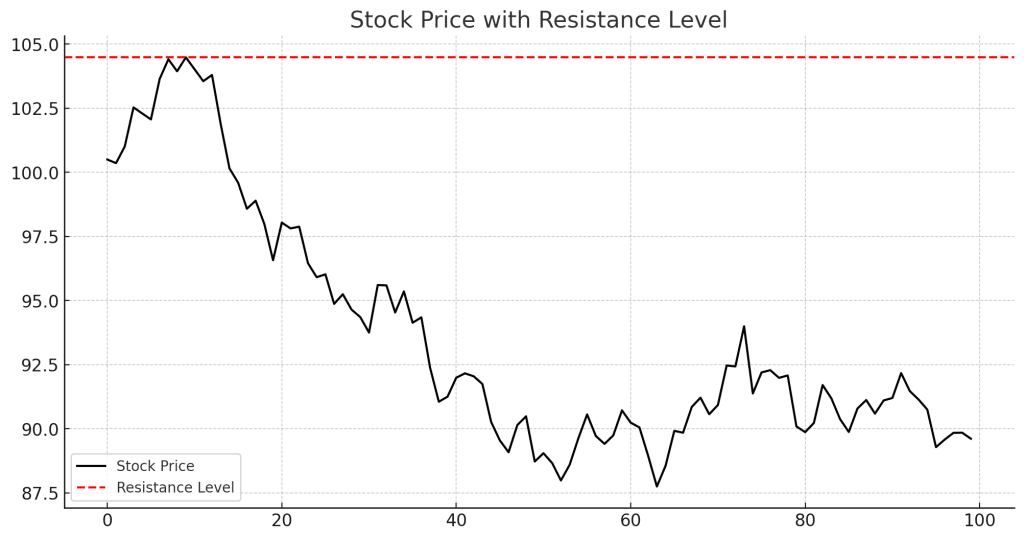
Introduction A Resistance Level is a price point where a stock or asset struggles to move above. It is formed […]
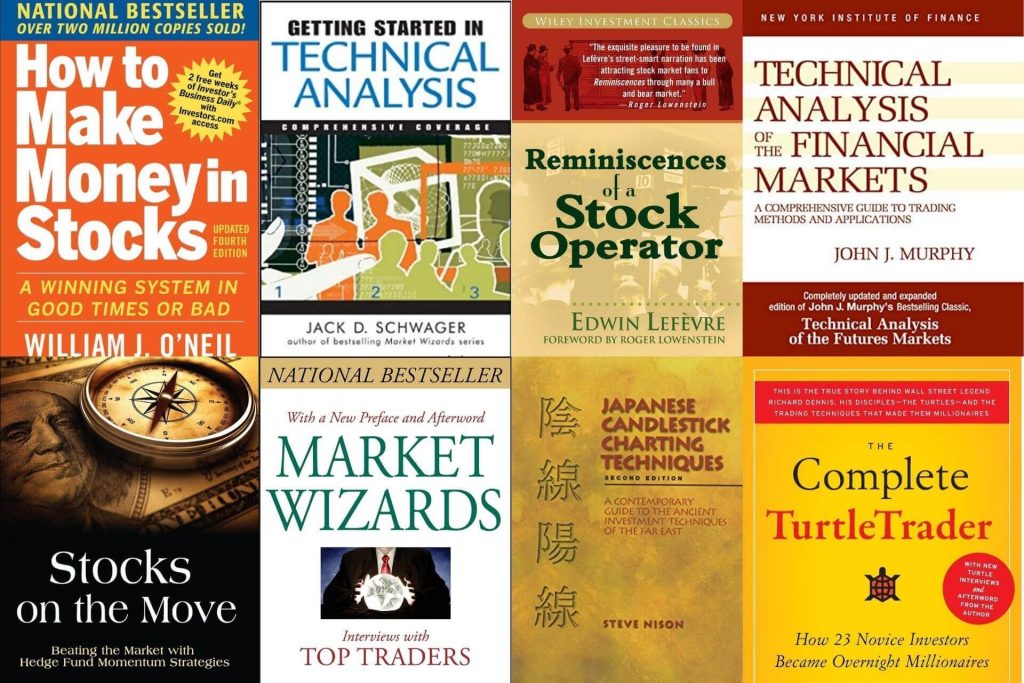
Finding the best stock trading books can be overwhelming, especially with so many options claiming to unlock market success. While […]

The Falling Wedge Pattern is a technical analysis chart pattern that signals a potential bullish reversal during a downtrend or […]

The Envelope Indicator is a technical analysis tool used by traders to identify overbought and oversold conditions, as well as […]

The double top pattern is a bearish reversal chart pattern that signals a potential shift from an uptrend to a […]

The descending wedge pattern, also known as the falling wedge, is a technical analysis chart pattern that typically indicates a […]

Introduction In the realm of technical analysis, chart patterns serve as essential tools for traders and investors to predict potential […]

The Alligator Indicator, developed by renowned trader and author Bill Williams, is a technical analysis tool designed to identify market […]
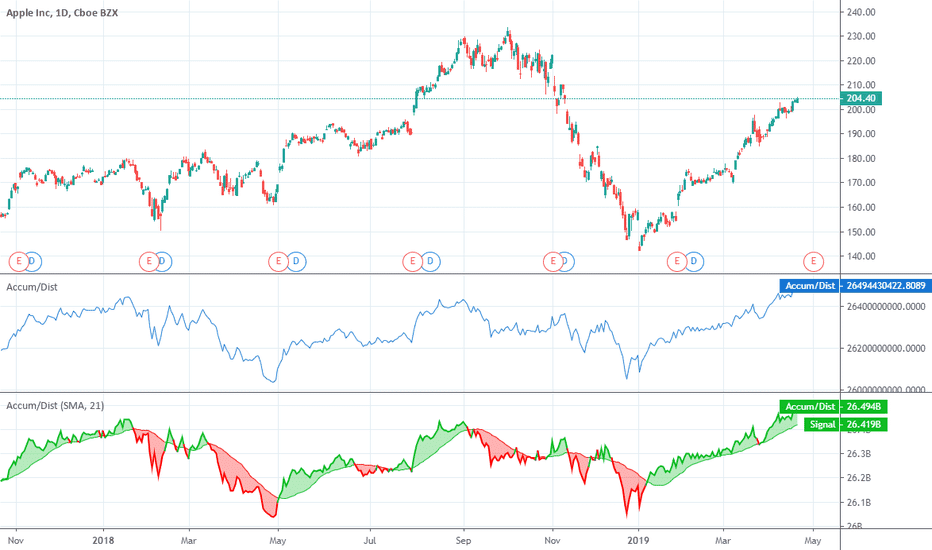
The Accumulation/Distribution (A/D) Indicator is a volume-based technical analysis tool developed to assess the cumulative flow of money into and […]